Exhibit 99.1

Supplemental Financial Report for the
Quarter Ended December 31, 2024
Exhibit 99.1
Supplemental Financial Report for the
Quarter Ended December 31, 2024
©2025 Greystone & Co. II LLC. All rights reserved. References to the term “Greystone,” refer to Greystone & Co. II LLC and/or its affiliated companies, as applicable. |
|
Supplemental Financial Report for the Quarter Ended December 31, 2024 |
|
Partnership Financial Information
TABLE OF CONTENTS
Letter from the CEO |
3 |
Quarterly Fact Sheet |
5 |
Financial Performance Information |
6 |
Appendices |
18 |
Important Disclosure Notices |
22 |
Other Partnership Information |
24 |
© 2025 Greystone & Co. II LLC |
|
Supplemental Financial Report for the Quarter Ended December 31, 2024 |
|
Letter from the CEO
I am pleased to report Greystone Housing Impact Investors LP’s operating results for the fourth quarter of 2024. We reported the following financial results as of and for the three months ended December 31, 2024:
The difference between reported net income per BUC and CAD per BUC is primarily due to the treatment of unrealized gains on our interest rate derivative positions. Unrealized gains of approximately $7.0 million are included in net income for the three months ended December 31, 2024. Unrealized gains are a result of the impact of increased market interest rates on the calculated fair value of our interest rate derivative positions. Unrealized gains and losses do not affect our cash earnings and are added back to net income when calculating CAD. We received net cash from our interest rate derivative positions totaling approximately $1.3 million during the fourth quarter.
We reported the following financial results for the year ended December 31, 2024:
We reported the following notable transactions during the fourth quarter of 2024:
© 2025 Greystone & Co. II LLC |
|
Supplemental Financial Report for the Quarter Ended December 31, 2024 |
|
In January 2025, we received proceeds from the sale of Vantage at Tomball located in Tomball, Texas, totaling $14.2 million, inclusive of the Partnership’s initial investment commitment made in August 2020. We estimate that we will not recognize any gain, loss, or CAD upon sale.
Other highlights of our investment portfolio include the following:
2024 was a challenging year from a number of different perspectives. The conditions in the multifamily markets, both higher interest rates and operating expenses, presented challenges to our joint venture equity investments. Interest rate volatility also impacted the efficiency of some of our securitization transactions. However, we are encouraged by the opportunities that we are starting to see in 2025. The dedicated pool of capital that we have from the new BlackRock construction lending joint venture is a powerful new tool for us to serve the needs of our affordable housing developer relationships.
We continue to observe that traditional bank affordable housing lenders are offering fewer loans or imposing more restrictive terms on borrowers, creating new opportunities for us to pursue beyond our normal pipeline. We will continue to strategically work with strong sponsors on new investment opportunities where traditional sources of capital may not currently be available. We will also continue to seek to develop new relationships, particularly with those sponsors that are existing clients of Greystone and its affiliates.
Thank you for your continued support of Greystone Housing Impact Investors LP!
Kenneth C. Rogozinski
Chief Executive Officer
© 2025 Greystone & Co. II LLC |
|
Supplemental Financial Report for the Quarter Ended December 31, 2024 |
|
Fourth Quarter 2024 Fact Sheet
PARTNERSHIP DETAILS |
|
Greystone Housing Impact Investors LP was formed for the primary purpose of acquiring a portfolio of MRBs that are issued to provide construction and/or permanent financing of affordable multifamily residential and commercial properties. The Partnership has also invested in GILs, which, similar to MRBs, provide financing for affordable multifamily properties. We expect and believe the interest paid on the MRBs and GILs to be excludable from gross income for federal income tax purposes. In addition, we have invested in equity interests in multifamily, market rate properties throughout the U.S. We continue to pursue a business strategy of acquiring additional MRBs and GILs on a leveraged basis, and other investments.
|
||||
(As of December 31, 2024) |
|
|||||
|
|
|||||
Symbol (NYSE) |
|
|
GHI |
|
||
Most Recent Quarterly Distribution per BUC (1) |
$ |
0.37 |
|
|||
|
|
|
|
|||
BUC Price |
$ |
10.25 |
|
|||
Year to Date Annualized Yield (2) |
|
15.1% |
|
|||
|
|
|
|
|
||
BUCs Outstanding |
|
|
23,171,226 |
|
||
Market Capitalization |
|
$ |
$237,505,067 |
|
||
52-week BUC price range |
|
$10.12 to $17.31 |
|
|||
|
|
|
|
|
||
|
|
|
|
|
||
Partnership Financial Information for Q4 2024 ($’s in 000’s, except per BUC amounts) |
|
|||||
|
12/31/2024 |
|
12/31/2023 |
|
||
|
|
|
|
|
||
Total Assets |
$1,579,700 |
|
$1,513,401 |
|
||
Leverage Ratio (3) |
75% |
|
72% |
|
||
|
|
|
|
|
||
|
Q4 2024 |
|
YTD 2024 |
|
||
|
|
|
|
|
||
Total Revenues |
$22,586 |
|
$91,271 |
|
||
Net Income |
$10,133 |
|
$21,323 |
|
||
Cash Available for Distribution (“CAD”) (4) |
$4,195 |
|
$21,947 |
|
||
Cash Distributions declared, per BUC (1) |
$0.370 |
|
$1.478 |
|
||
BUCs Distributions declared, per BUC (1) |
$- |
|
$0.070 |
|
||
© 2025 Greystone & Co. II LLC |
|
Supplemental Financial Report for the Quarter Ended December 31, 2024 |
|
Operating Results Summary
(Dollar amounts in thousands, except per BUC information)
|
|
Q4 2023 |
|
|
Q1 2024 |
|
|
Q2 2024 |
|
|
Q3 2024 |
|
|
Q4 2024 |
|
|||||
Total revenues |
|
$ |
25,185 |
|
|
$ |
22,371 |
|
|
$ |
21,969 |
|
|
$ |
24,345 |
|
|
$ |
22,586 |
|
Total expenses |
|
|
(29,327 |
) |
|
|
(11,667 |
) |
|
|
(17,860 |
) |
|
|
(28,279 |
) |
|
|
(12,371 |
) |
Gain on sale of real estate assets |
|
|
10,363 |
|
|
|
- |
|
|
|
64 |
|
|
|
- |
|
|
|
- |
|
Gain on sale of mortgage revenue bonds |
|
|
- |
|
|
|
- |
|
|
|
1,012 |
|
|
|
- |
|
|
|
1,208 |
|
Gain on sale of investments in unconsolidated entities |
|
|
- |
|
|
|
50 |
|
|
|
7 |
|
|
|
- |
|
|
|
61 |
|
Earnings (losses) from investments in unconsolidated entities |
|
|
(18 |
) |
|
|
(107 |
) |
|
|
(15 |
) |
|
|
(704 |
) |
|
|
(1,315 |
) |
Income tax (expense) benefit |
|
|
1 |
|
|
|
1 |
|
|
|
1 |
|
|
|
2 |
|
|
|
(36 |
) |
Net income (loss) |
|
$ |
6,204 |
|
|
$ |
10,648 |
|
|
$ |
5,178 |
|
|
$ |
(4,636 |
) |
|
$ |
10,133 |
|
|
|
|
|
|
|
|
|
|
|
|
|
|
|
|
|
|||||
Per BUC operating metrics(1): |
|
|
|
|
|
|
|
|
|
|
|
|
|
|
|
|||||
Net income (loss) |
|
$ |
0.24 |
|
|
$ |
0.42 |
|
|
$ |
0.19 |
|
|
$ |
(0.23 |
) |
|
$ |
0.39 |
|
Cash available for distribution |
|
$ |
0.27 |
|
|
$ |
0.23 |
|
|
$ |
0.27 |
|
|
$ |
0.27 |
|
|
$ |
0.18 |
|
|
|
|
|
|
|
|
|
|
|
|
|
|
|
|
|
|||||
Per BUC distribution information(1): |
|
|
|
|
|
|
|
|
|
|
|
|
|
|
|
|||||
Cash distributions declared |
|
$ |
0.37 |
|
|
$ |
0.37 |
|
|
$ |
0.37 |
|
|
$ |
0.37 |
|
|
$ |
0.37 |
|
BUC distributions declared |
|
|
0.07 |
|
|
|
0.07 |
|
|
|
- |
|
|
|
- |
|
|
|
- |
|
Total distributions declared |
|
$ |
0.44 |
|
|
$ |
0.44 |
|
|
$ |
0.37 |
|
|
$ |
0.37 |
|
|
$ |
0.37 |
|
|
|
|
|
|
|
|
|
|
|
|
|
|
|
|
|
|||||
Weighted average BUCs outstanding |
|
|
22,852,500 |
|
|
|
23,000,754 |
|
|
|
23,083,387 |
|
|
|
23,085,261 |
|
|
|
23,115,162 |
|
BUCs outstanding, end of period |
|
|
22,897,187 |
|
|
|
23,057,328 |
|
|
|
23,085,261 |
|
|
|
23,085,261 |
|
|
|
23,171,226 |
|
© 2025 Greystone & Co. II LLC |
|
Supplemental Financial Report for the Quarter Ended December 31, 2024 |
|
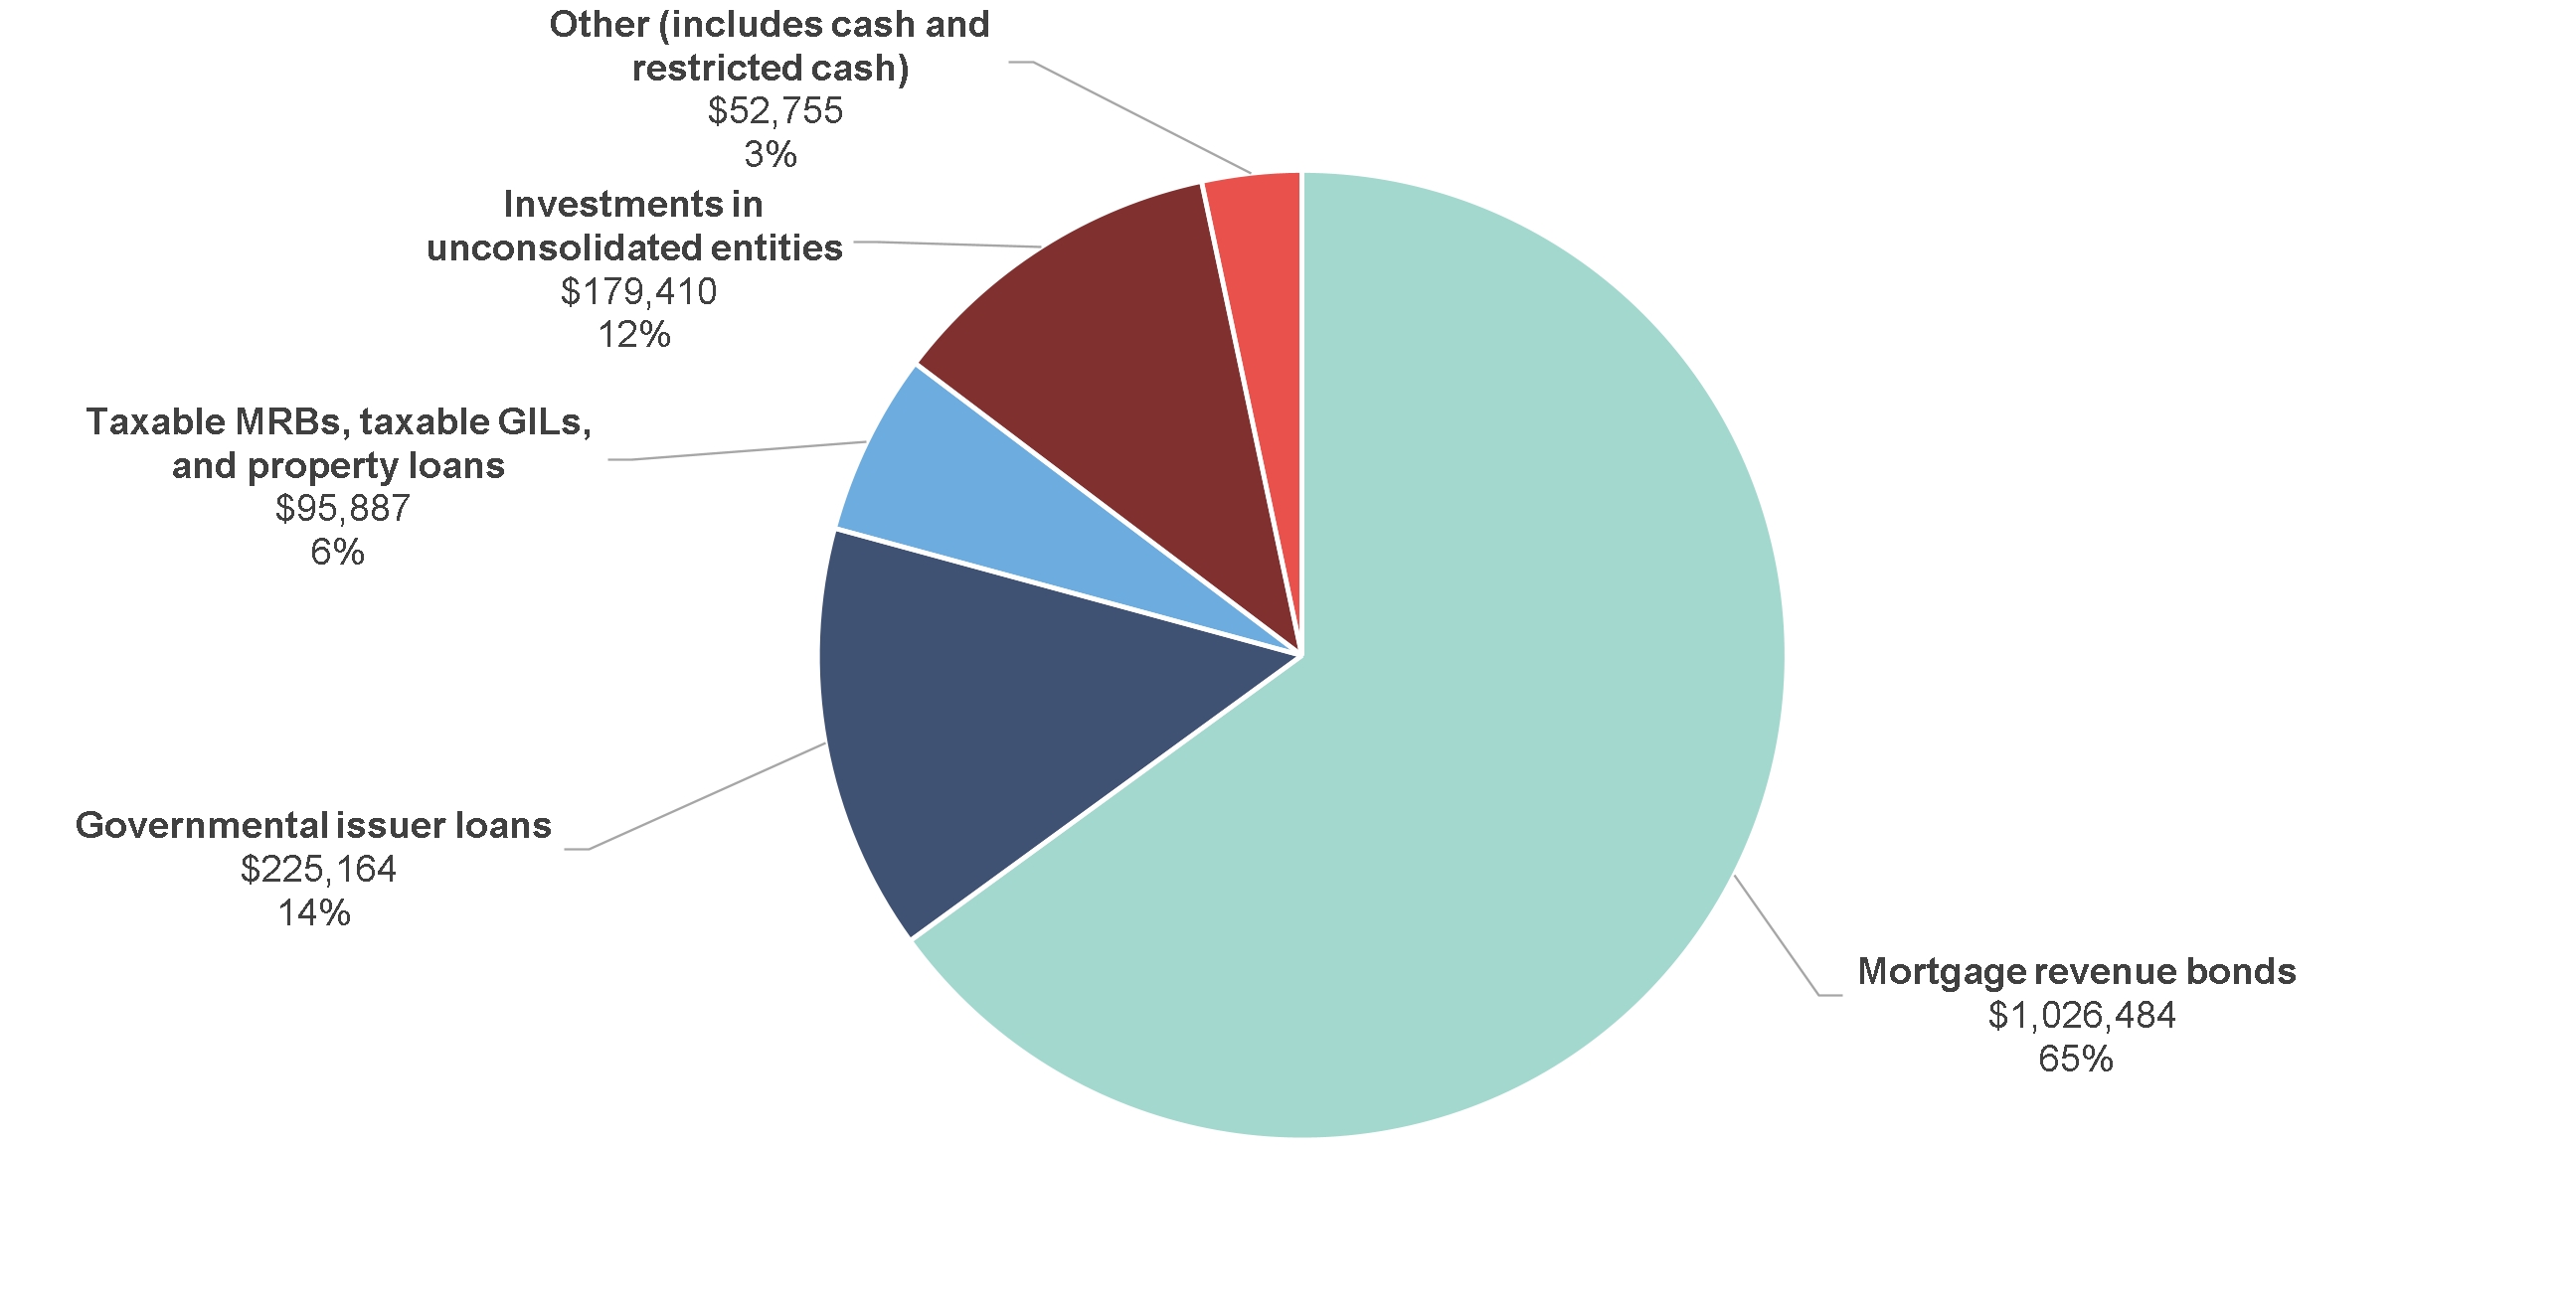
Asset Profile
(Dollar amounts in thousands)
© 2025 Greystone & Co. II LLC |
|
Supplemental Financial Report for the Quarter Ended December 31, 2024 |
|
Mortgage Investments to Total Assets Profile
(Dollar amounts in thousands)
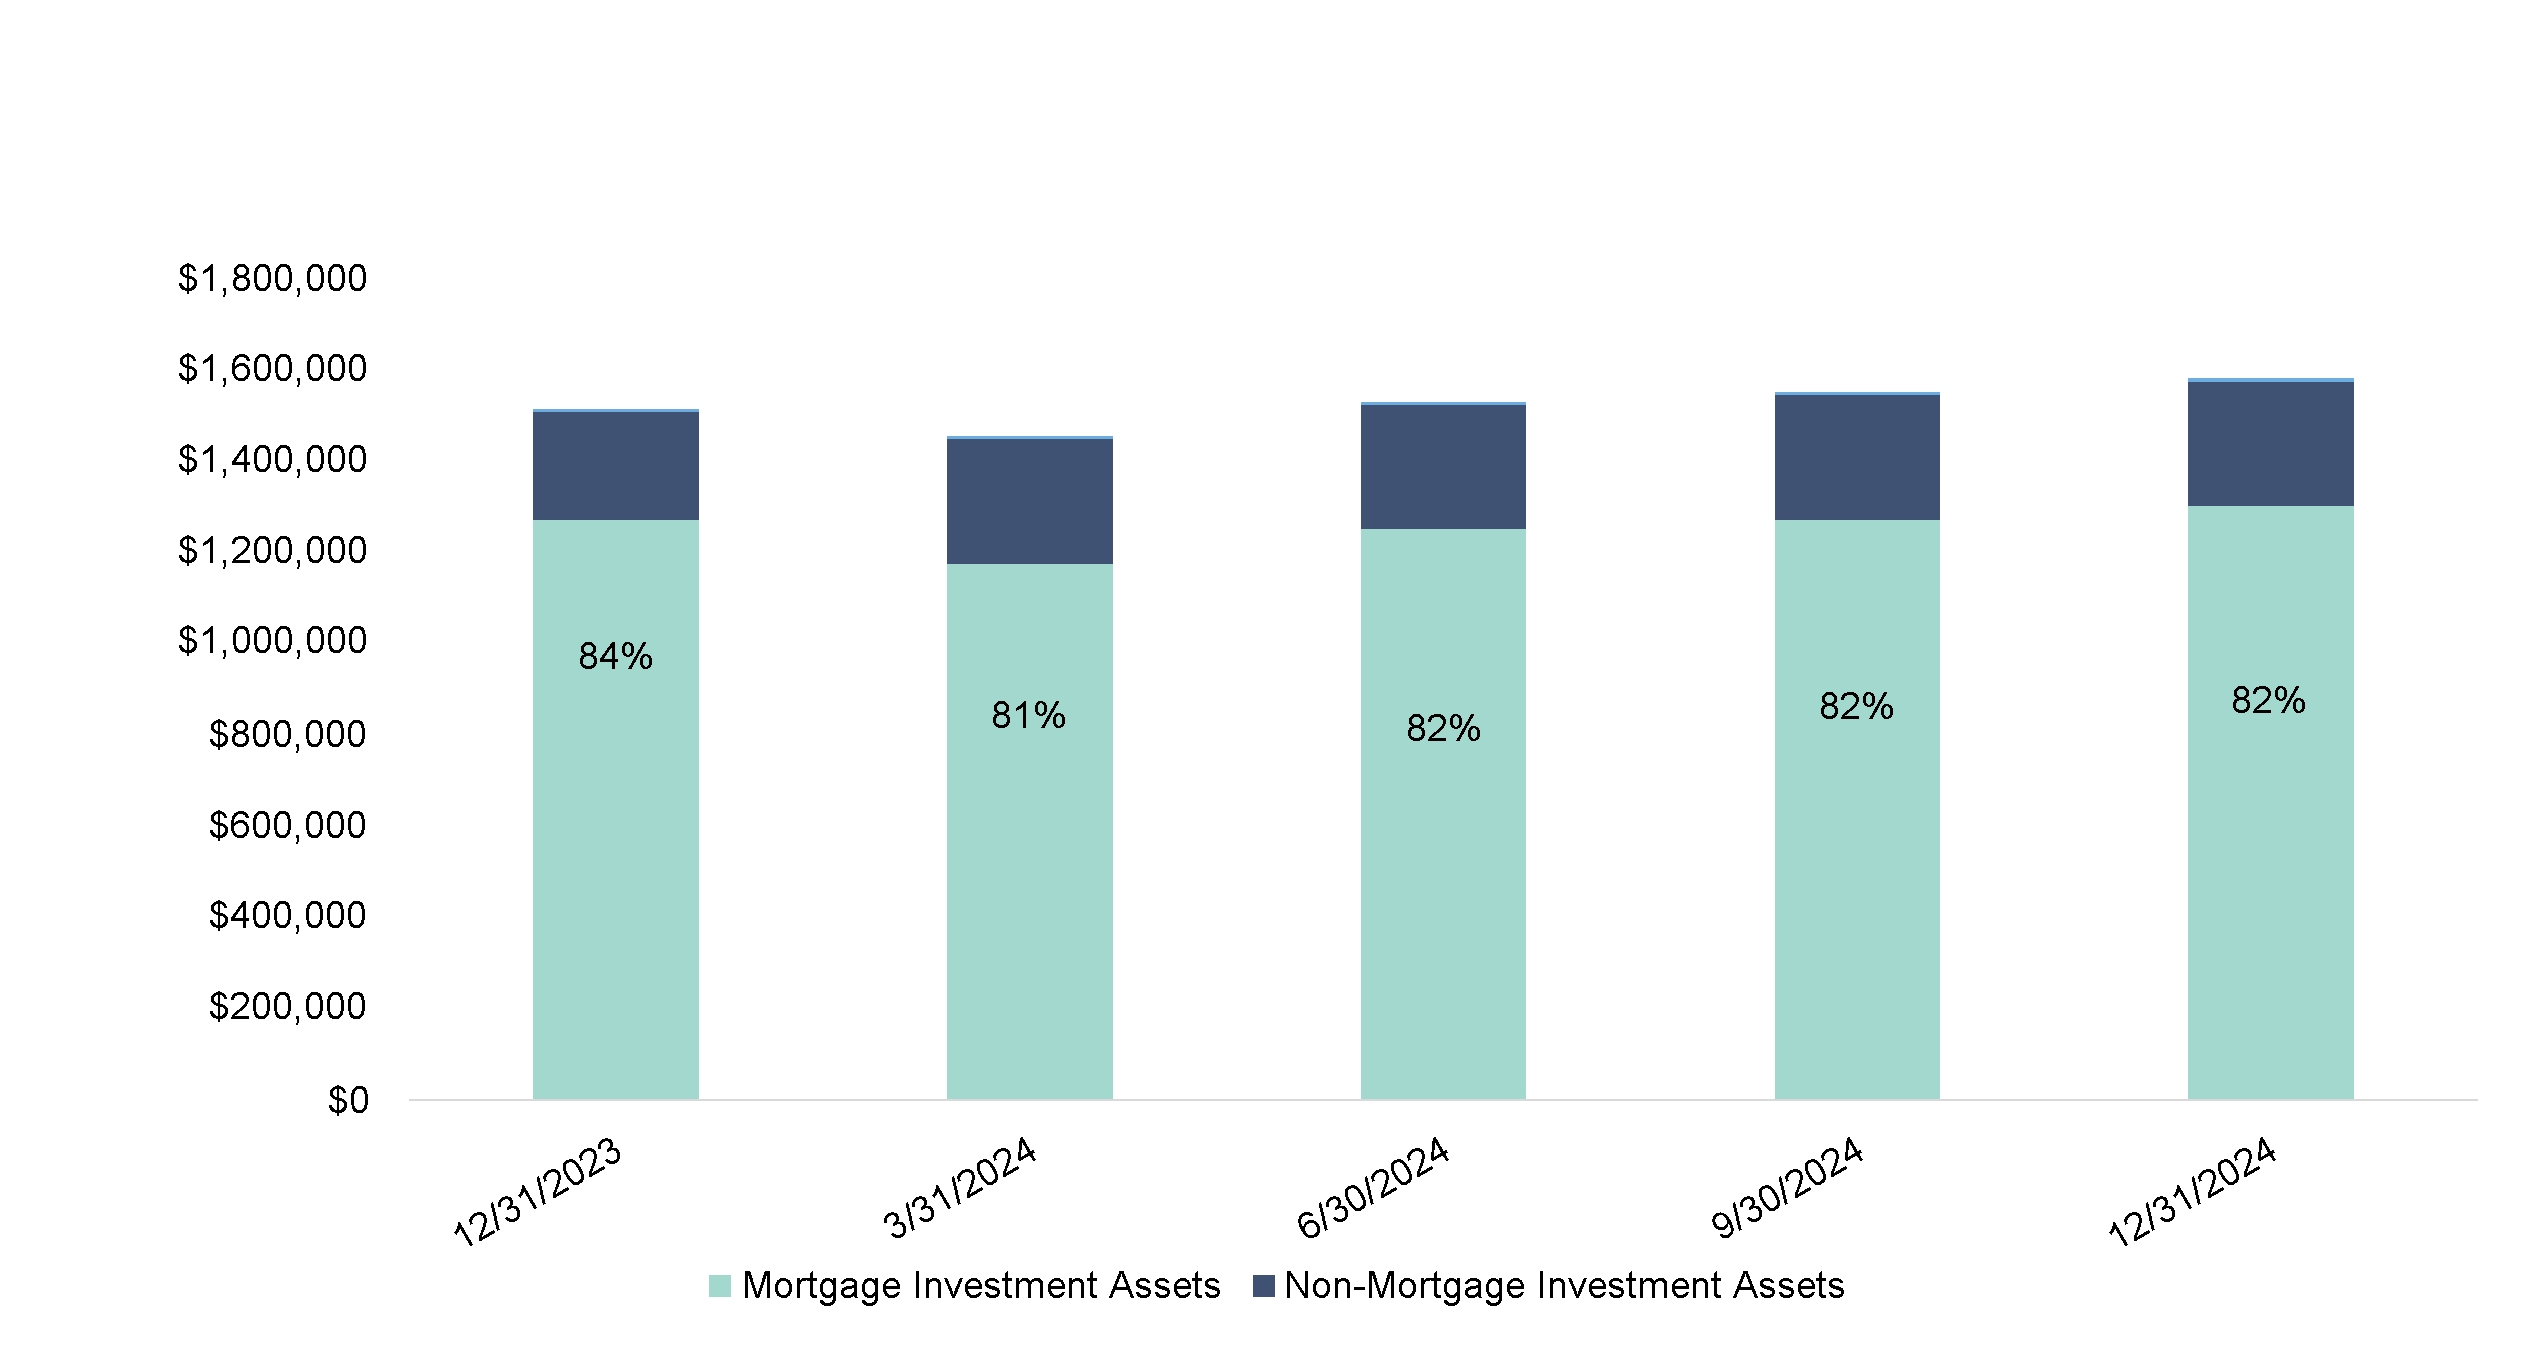
Note: Mortgage Investments include the Partnership’s Mortgage Revenue Bonds, Governmental Issuer Loans, Taxable Mortgage Revenue
Bonds, Taxable Governmental Issuer Loans, and Property Loans that share a first mortgage lien with the Governmental Issuer Loans.
© 2025 Greystone & Co. II LLC |
|
Supplemental Financial Report for the Quarter Ended December 31, 2024 |
|
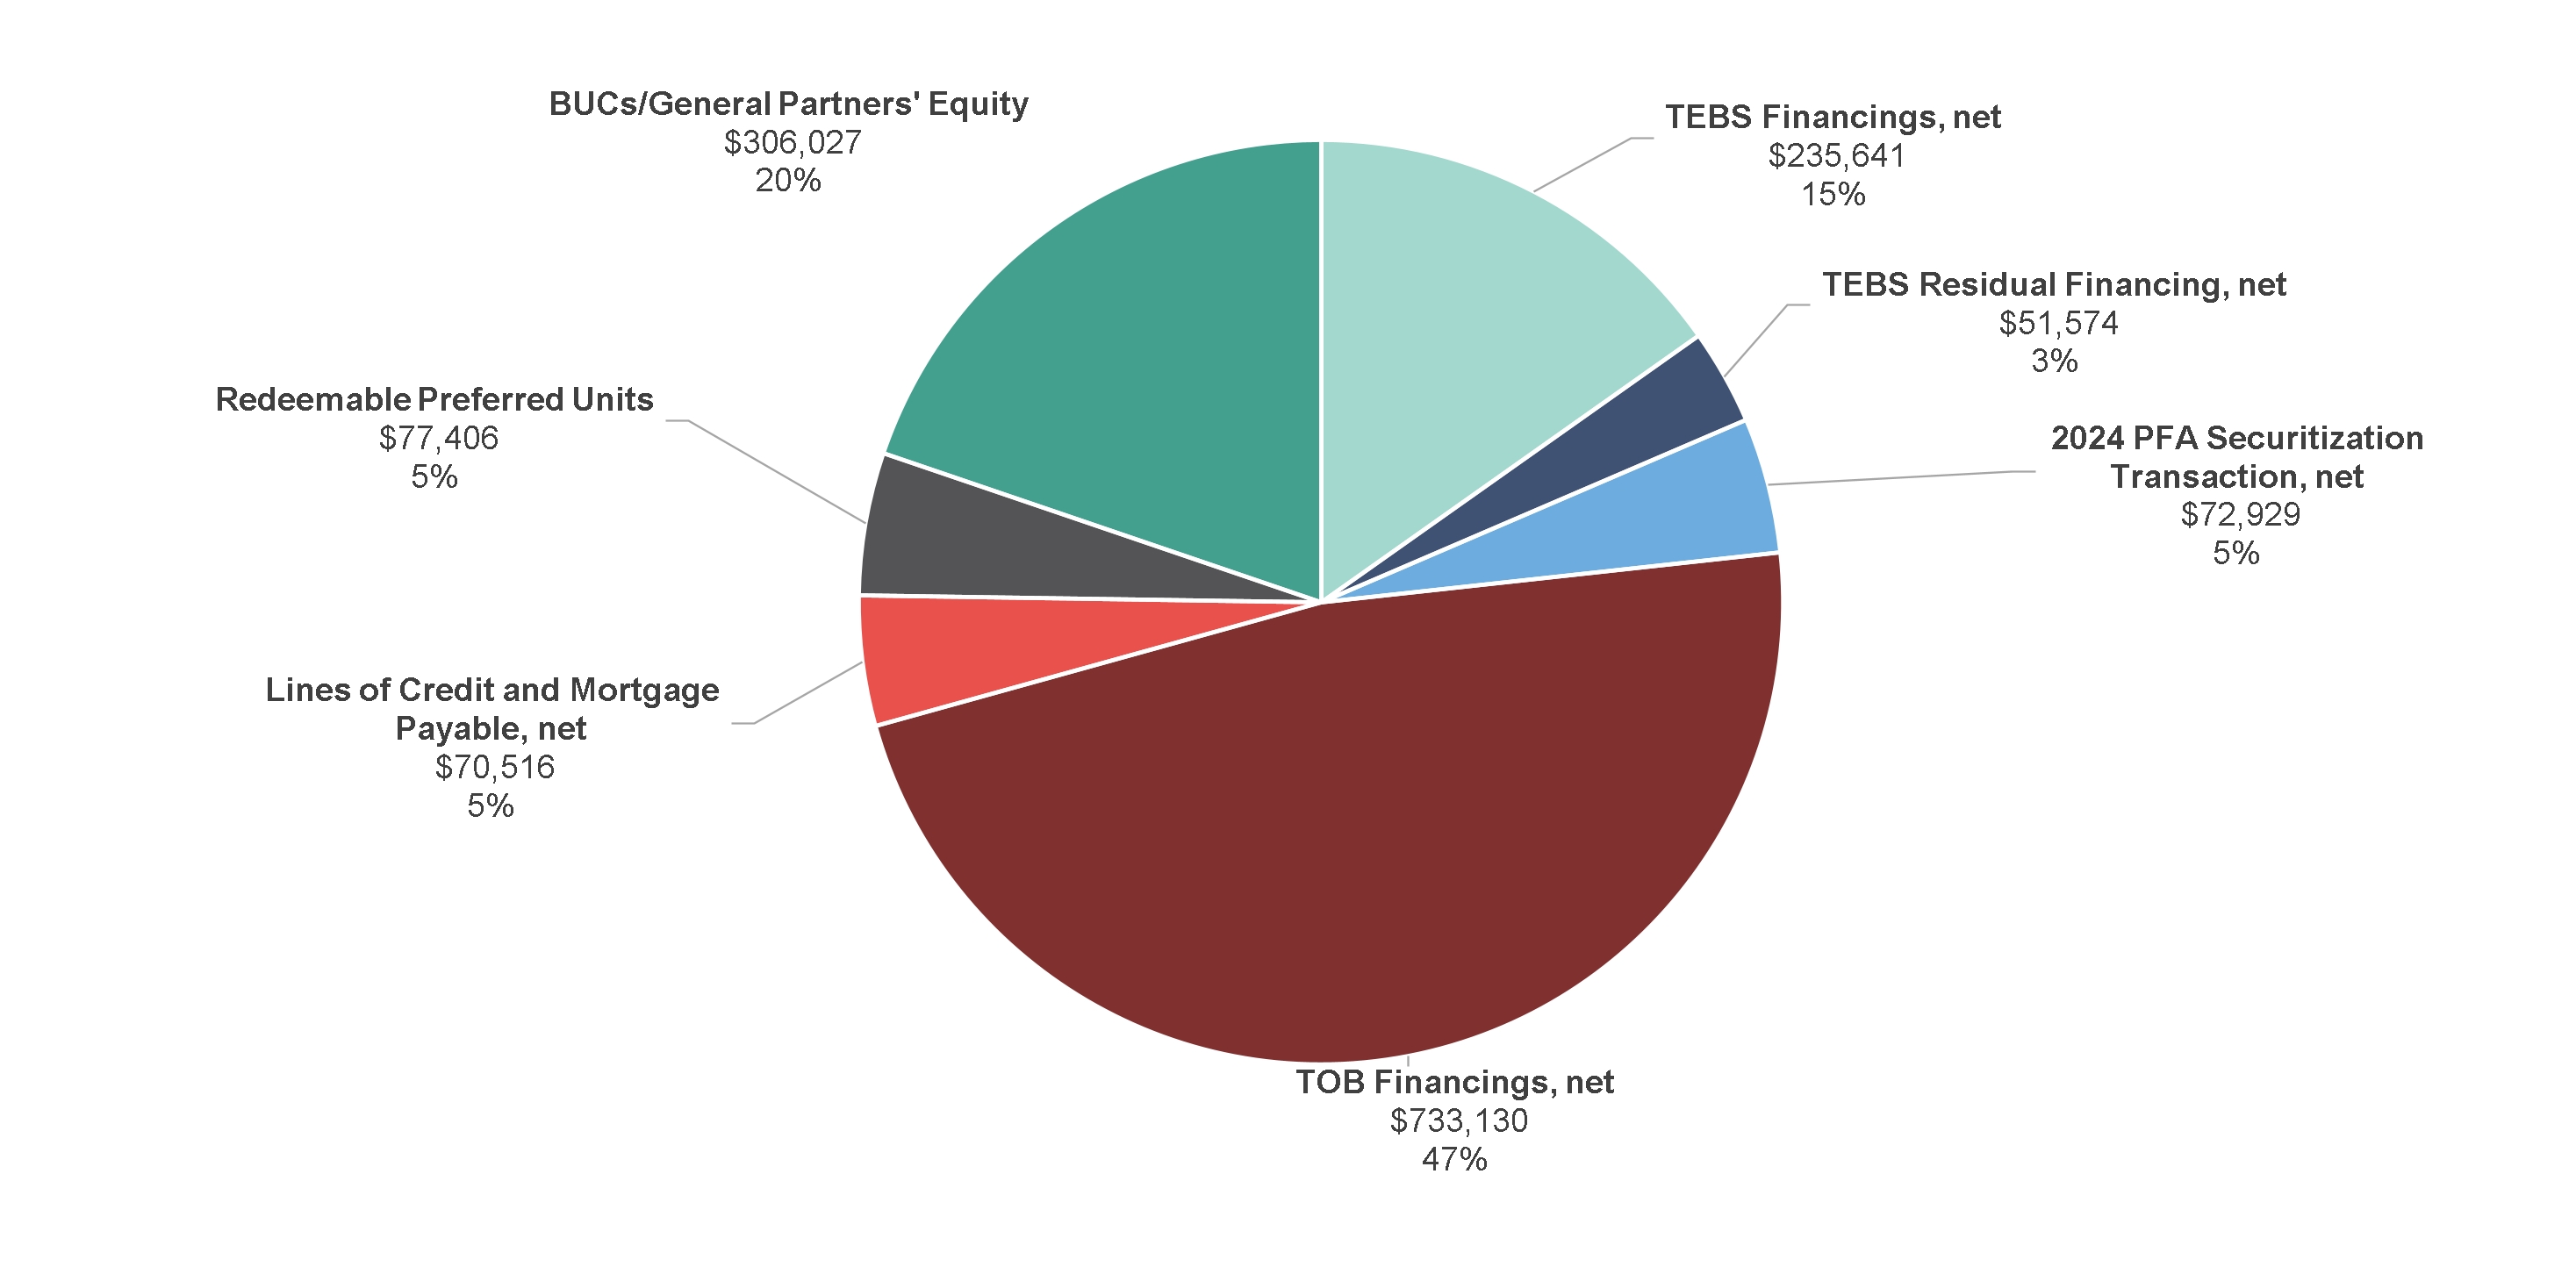
Debt and Equity Profile
(Dollar amounts in thousands)
© 2025 Greystone & Co. II LLC |
|
Supplemental Financial Report for the Quarter Ended December 31, 2024 |
|
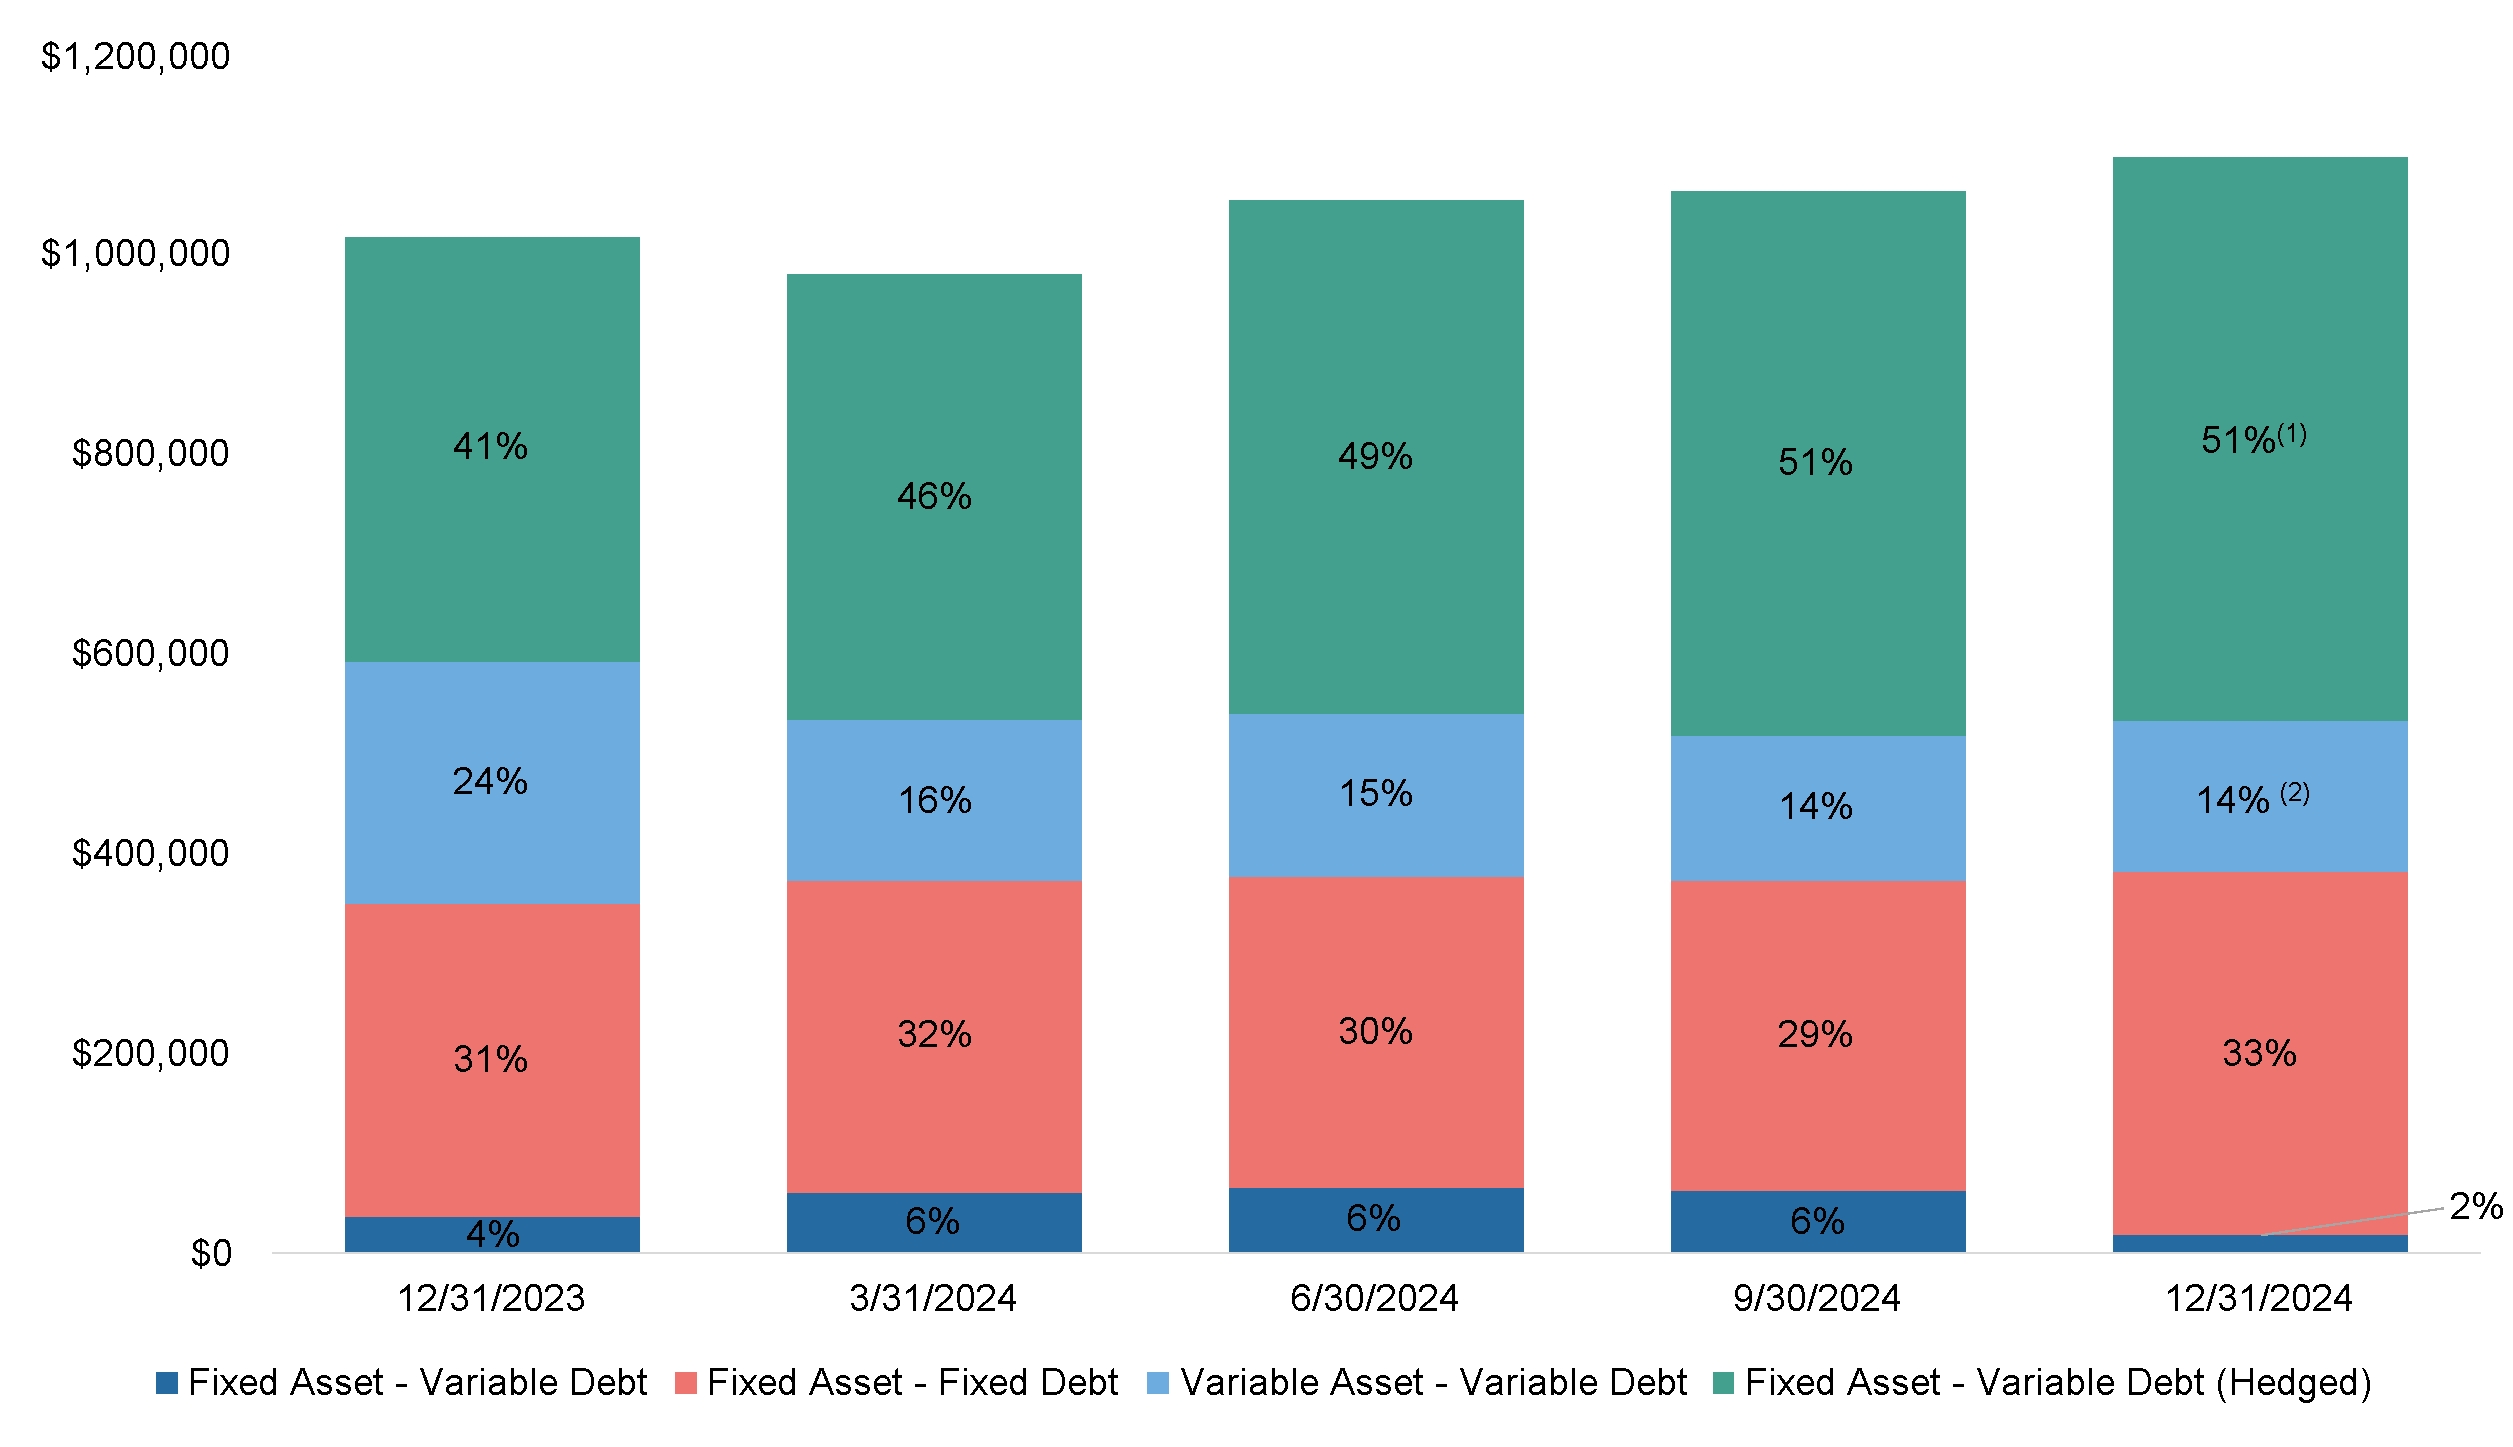
Debt Financing
(Dollar amounts in thousands)
© 2025 Greystone & Co. II LLC |
|
Supplemental Financial Report for the Quarter Ended December 31, 2024 |
|
Debt Investments Activity
(Dollar amounts in thousands)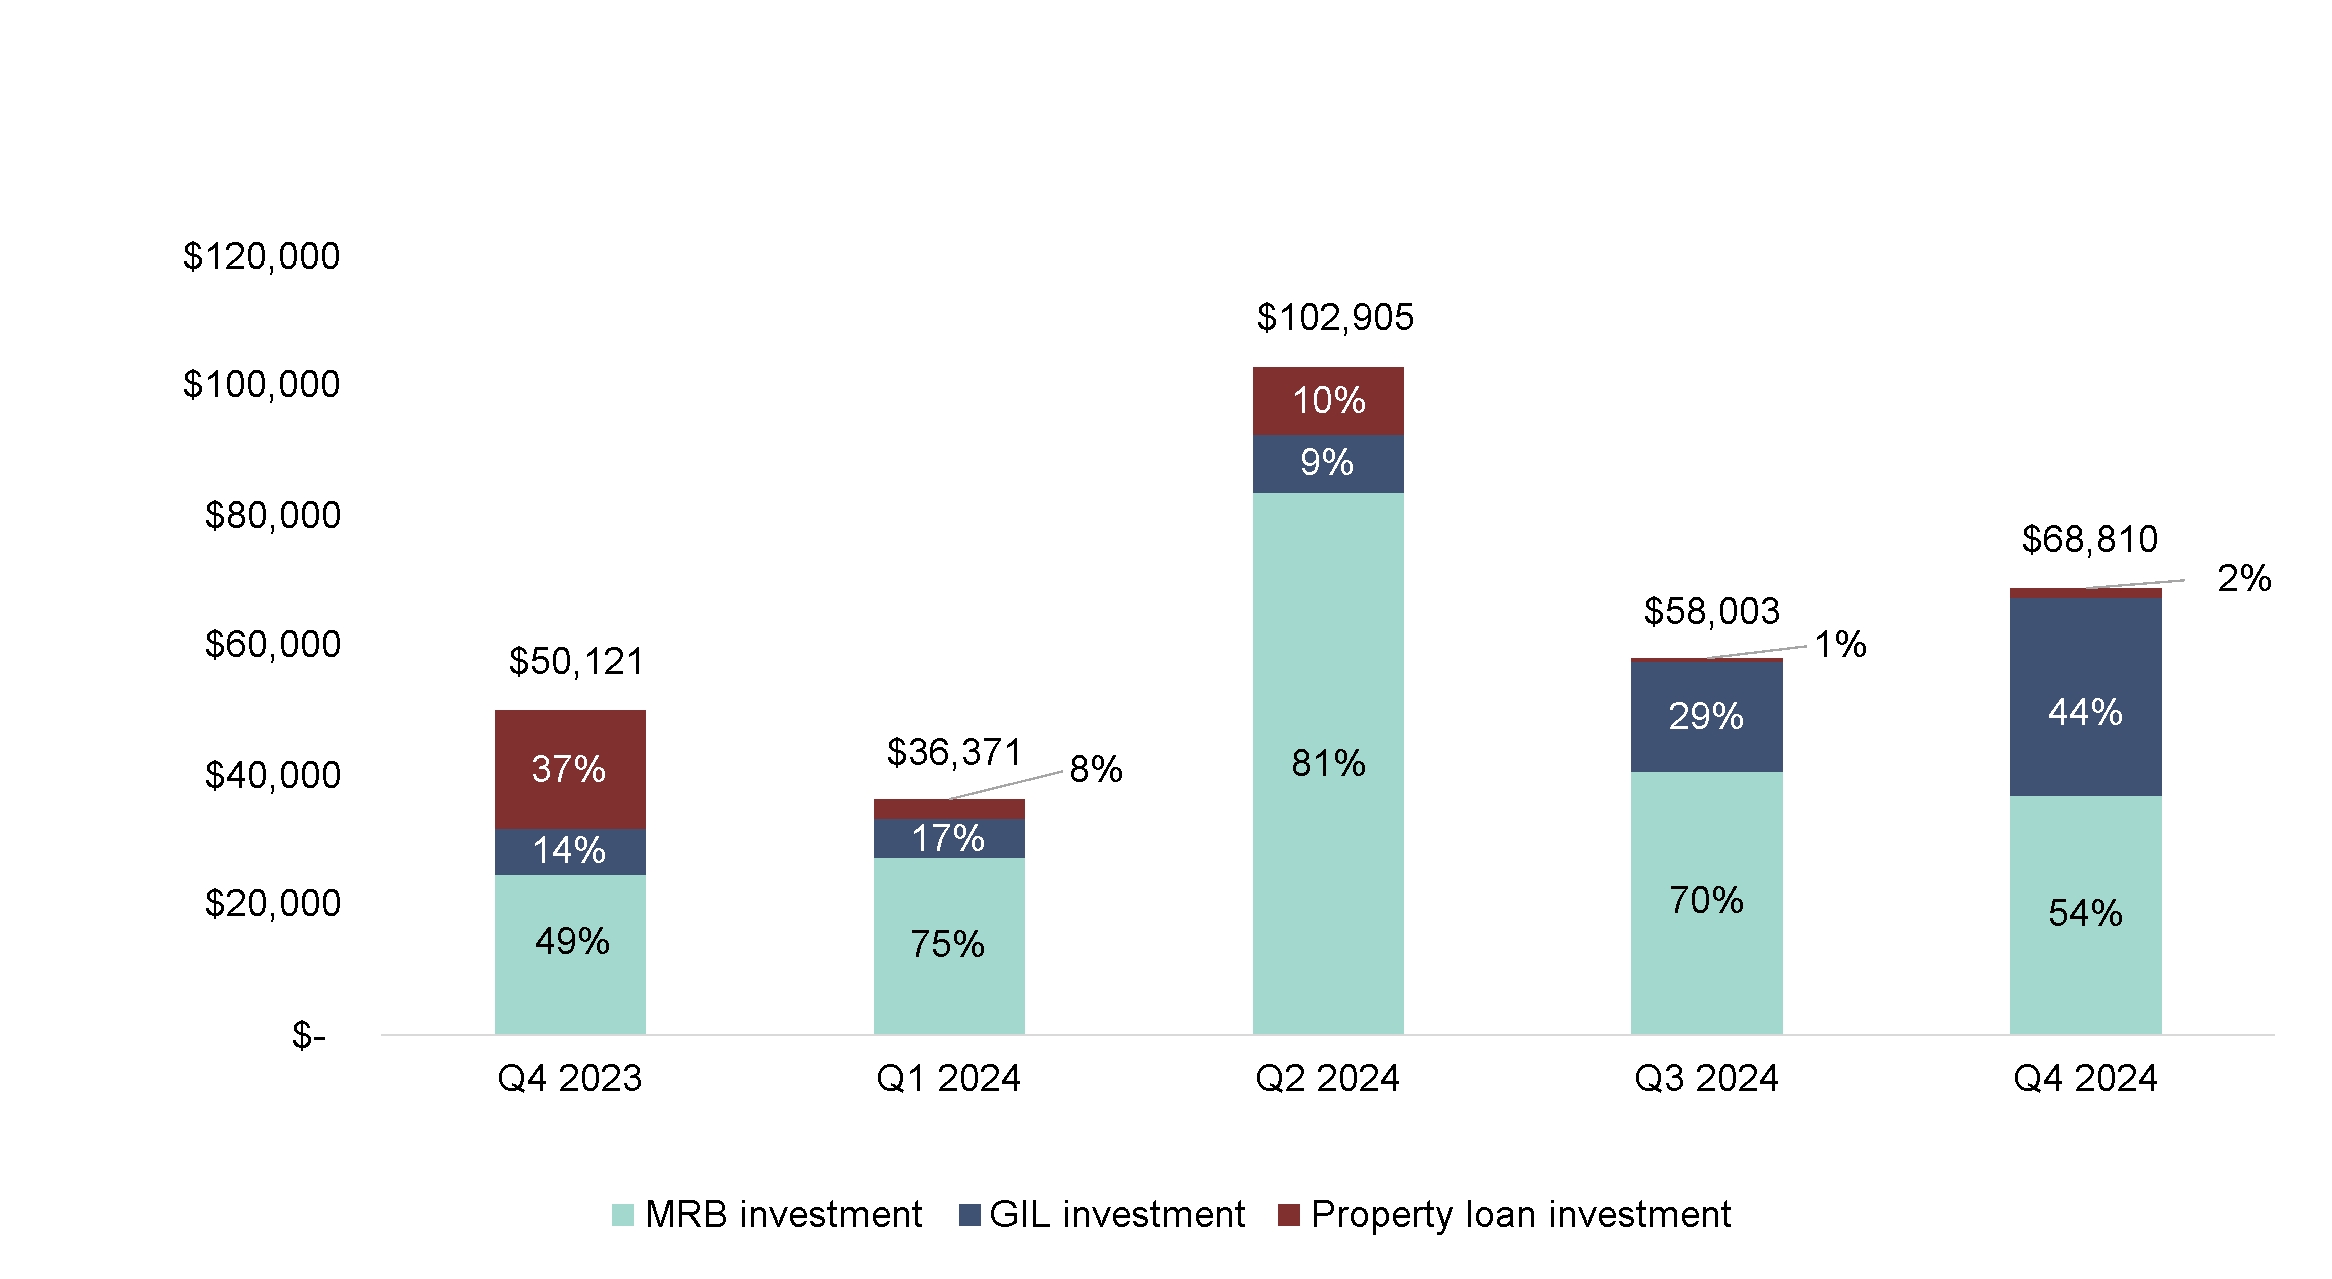
Quarterly Activity |
Q4 2023 |
|
Q1 2024 |
|
Q2 2024 |
|
Q3 2024 |
|
Q4 2024 |
|
|||||
Investment Purchases |
$ |
50,121 |
|
$ |
36,371 |
|
$ |
102,905 |
|
$ |
58,003 |
|
$ |
68,810 |
|
Sales and Redemptions |
|
(57,293 |
) |
|
(120,050 |
) |
|
(10,281 |
) |
|
(57,339 |
) |
|
(13,267 |
) |
Net Investment Activity |
|
(7,172 |
) |
|
(83,679 |
) |
|
92,624 |
|
|
664 |
|
|
55,543 |
|
Net Debt (Proceeds) Repayment |
|
18,007 |
|
|
53,348 |
|
|
(88,657 |
) |
|
1,233 |
|
|
(48,134 |
) |
Net Capital Deployed |
$ |
10,835 |
|
$ |
(30,331 |
) |
$ |
3,967 |
|
$ |
1,897 |
|
$ |
7,409 |
|
© 2025 Greystone & Co. II LLC |
|
Supplemental Financial Report for the Quarter Ended December 31, 2024 |
|
JV Equity Investments Activity
(Dollar amounts in thousands)
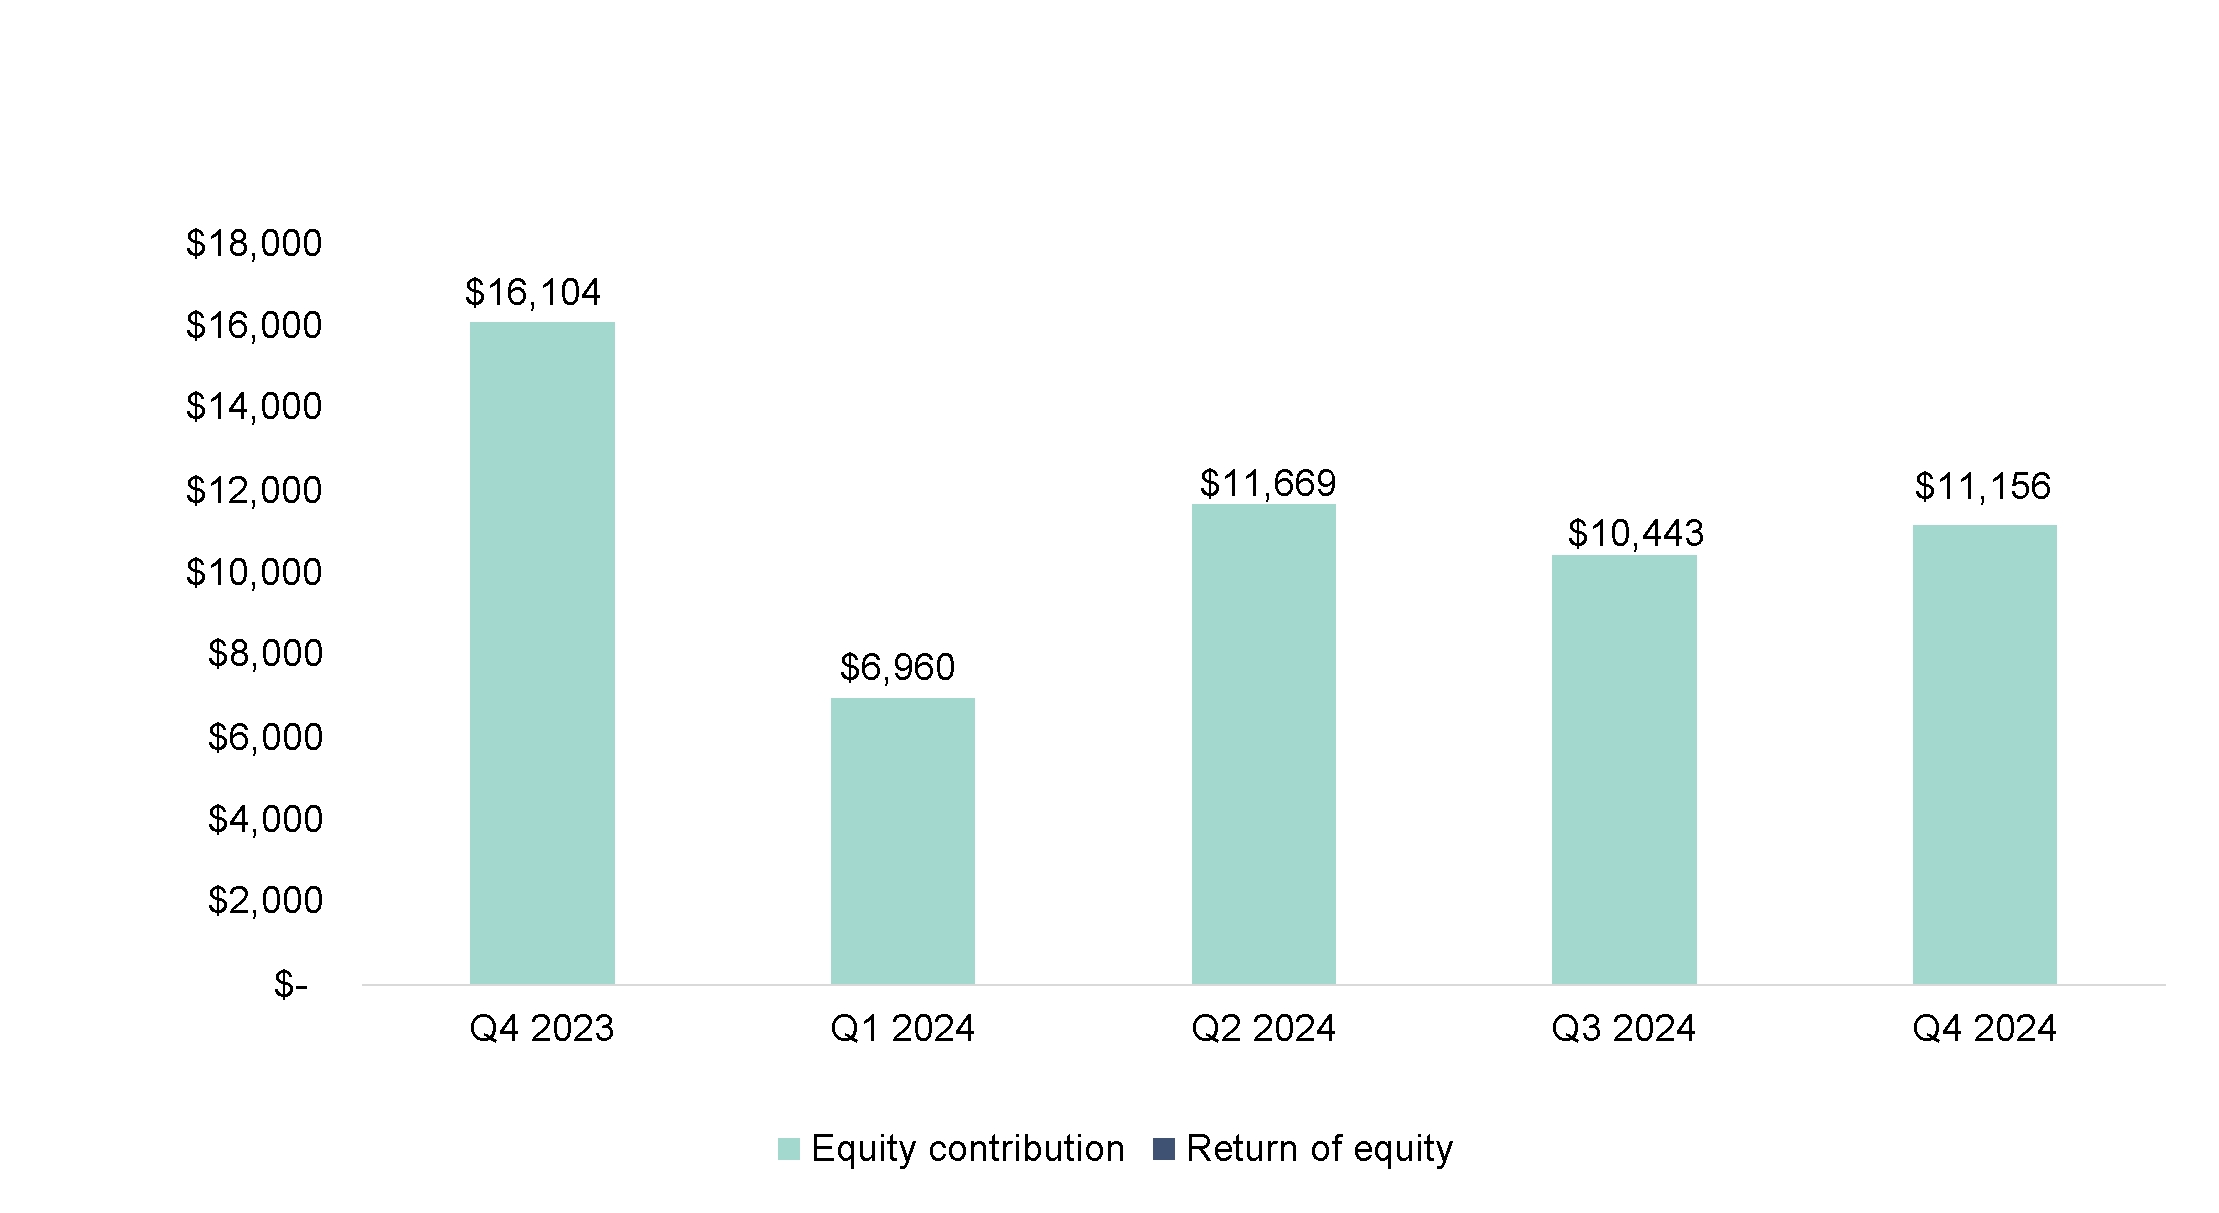
Quarterly Activity |
Q4 2023 |
|
Q1 2024 |
|
Q2 2024 |
|
Q3 2024 |
|
Q4 2024 |
|
|||||
JV Equity Contributions |
$ |
16,104 |
|
$ |
6,960 |
|
$ |
11,669 |
|
$ |
10,443 |
|
$ |
11,156 |
|
Return of JV Equity Contributions |
|
- |
|
|
- |
|
|
- |
|
|
- |
|
|
- |
|
Net Investment Activity |
|
16,104 |
|
|
6,960 |
|
|
11,669 |
|
|
10,443 |
|
|
11,156 |
|
Net Debt Proceeds |
|
- |
|
|
- |
|
|
(10,000 |
) |
|
(14,000 |
) |
|
(9,500 |
) |
Net Capital Deployed |
$ |
16,104 |
|
$ |
6,960 |
|
$ |
1,669 |
|
$ |
(3,557 |
) |
$ |
1,656 |
|
© 2025 Greystone & Co. II LLC |
|
Supplemental Financial Report for the Quarter Ended December 31, 2024 |
|
Net Book Value Waterfall
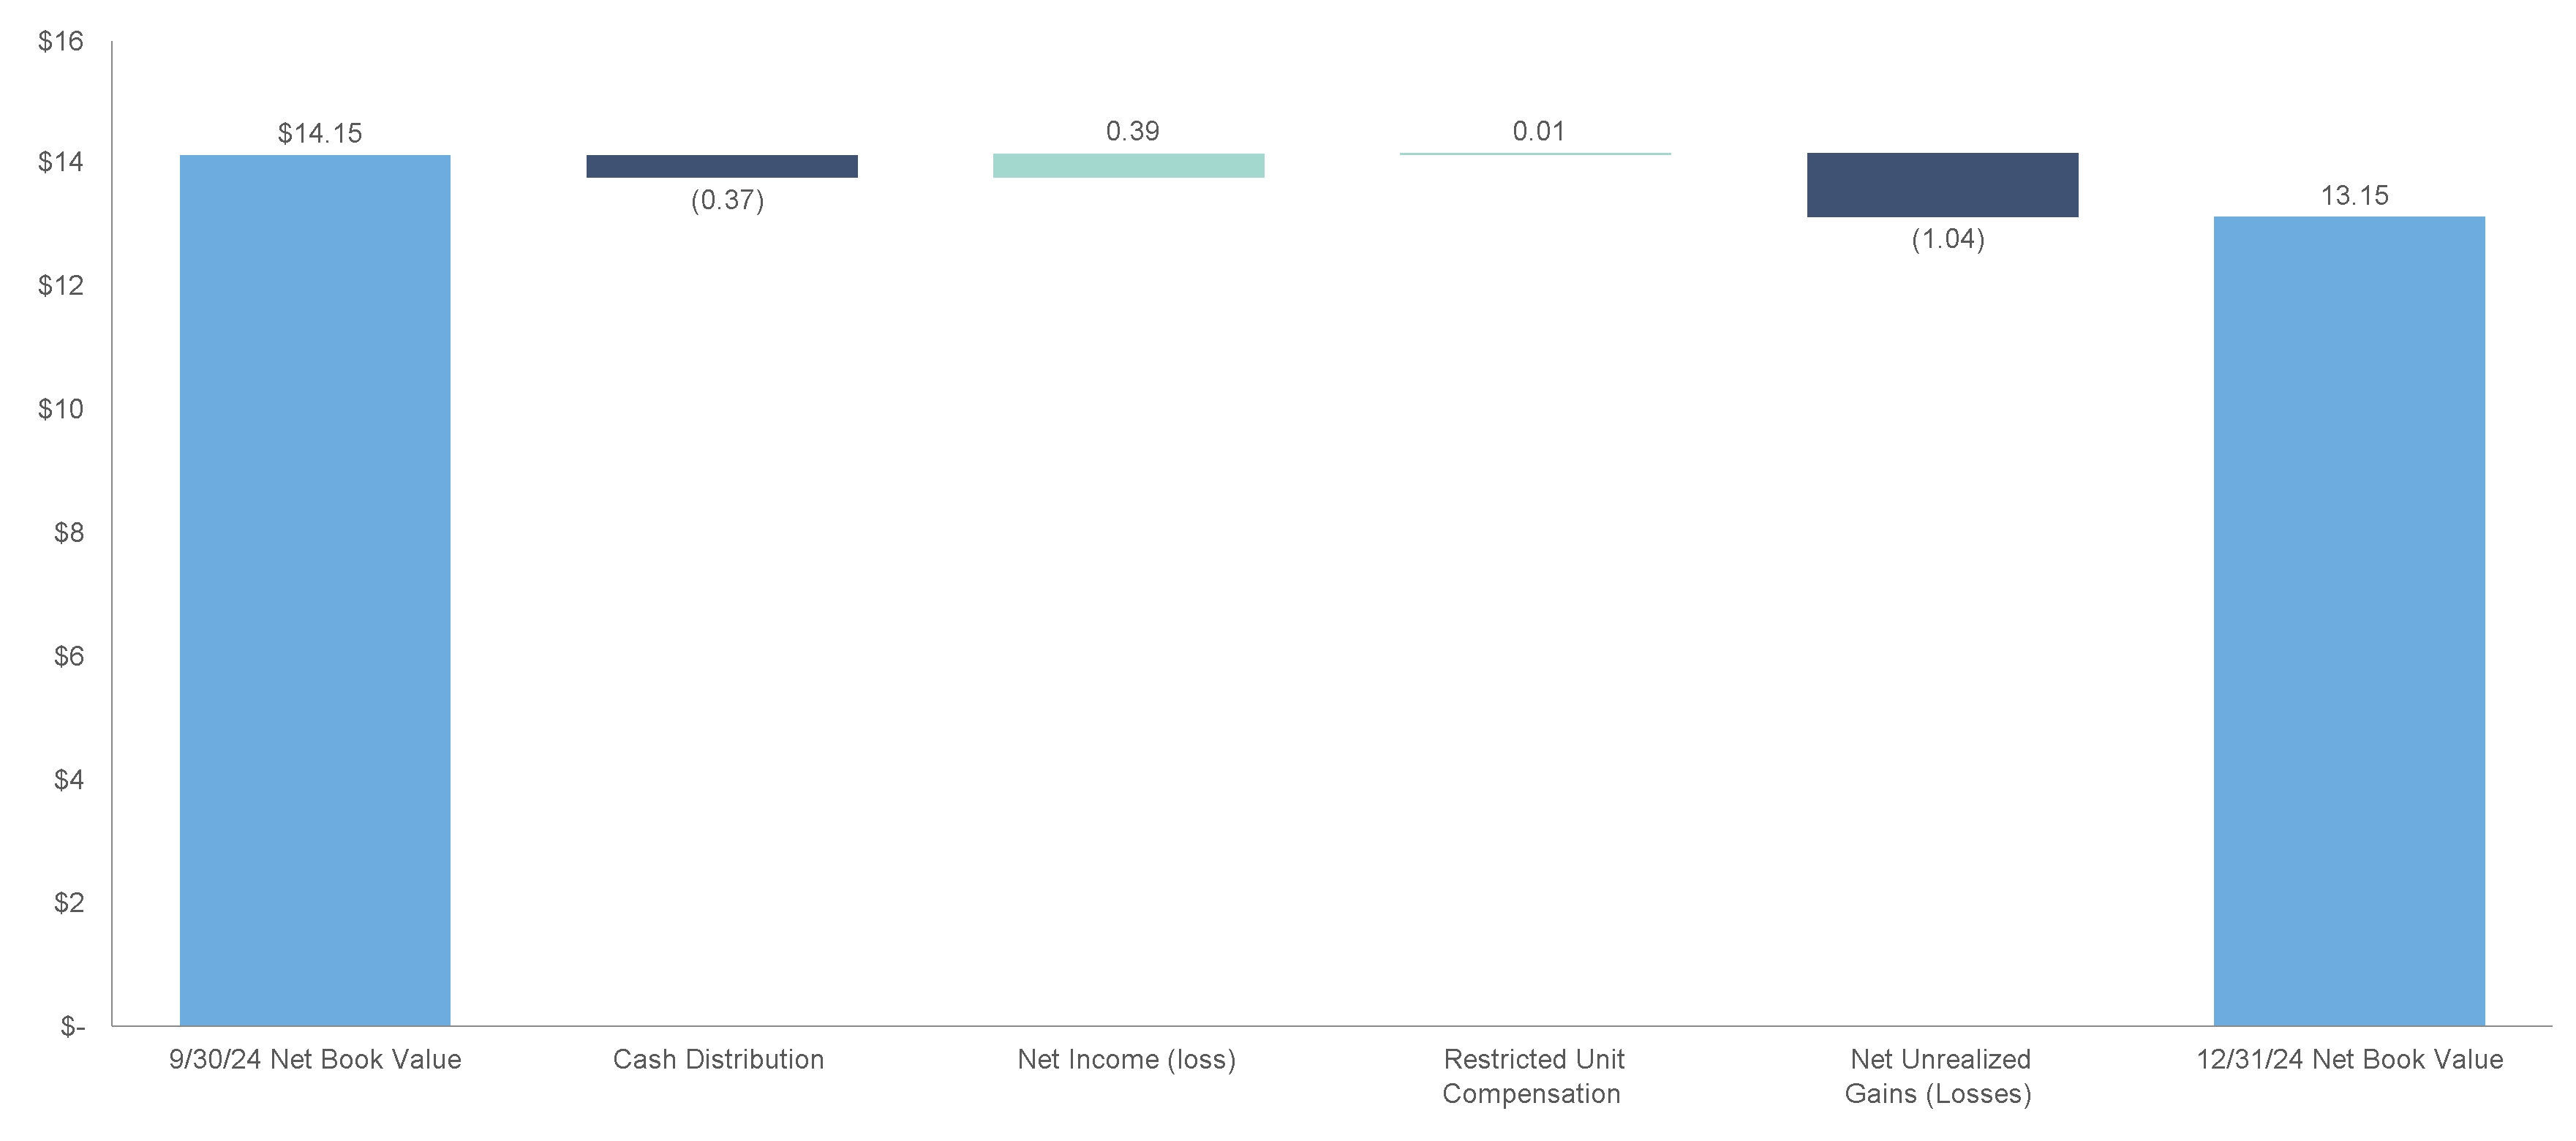
Note: Per unit data derived from weighted average BUCs outstanding during the period, except for the Net Book Values, which are based on
shares outstanding on the stated date. Numbers may not sum due to rounding.
© 2025 Greystone & Co. II LLC |
|
Supplemental Financial Report for the Quarter Ended December 31, 2024 |
|
Interest Rate Sensitivity Analysis
The interest rate sensitivity table below represents the change in interest income from investments, net of interest on debt and settlement payments for interest rate derivatives over the next twelve months, assuming an immediate parallel shift in the SOFR yield curve and the resulting implied forward rates are realized as a component of this shift in the curve and assuming management does not adjust its strategy in response. The amounts in the table below do not consider any potential unrealized gains or losses from derivatives in determining the net interest income impact.
Description |
|
- 100 basis points |
|
- 50 basis points |
|
+ 50 basis points |
|
+ 100 basis points |
|
+ 200 basis points |
TOB Debt Financings |
|
$4,133,337 |
|
$2,066,668 |
|
$(2,066,668) |
|
$(4,133,337) |
|
$(8,266,674) |
Other Financings & Derivatives |
|
(2,636,771) |
|
(1,318,386) |
|
1,318,386 |
|
2,636,771 |
|
5,273,543 |
Variable Rate Investments |
|
(269,194) |
|
(134,597) |
|
134,597 |
|
269,194 |
|
538,388 |
Net Interest Income Impact |
|
$1,227,372 |
|
$613,685 |
|
$(613,685) |
|
$(1,227,372) |
|
$(2,454,743) |
|
|
|
|
|
|
|
|
|
|
|
Per BUC Impact (1) |
|
$0.053 |
|
$0.026 |
|
$(0.026) |
|
$(0.053) |
|
$(0.106) |
© 2025 Greystone & Co. II LLC |
|
Supplemental Financial Report for the Quarter Ended December 31, 2024 |
|
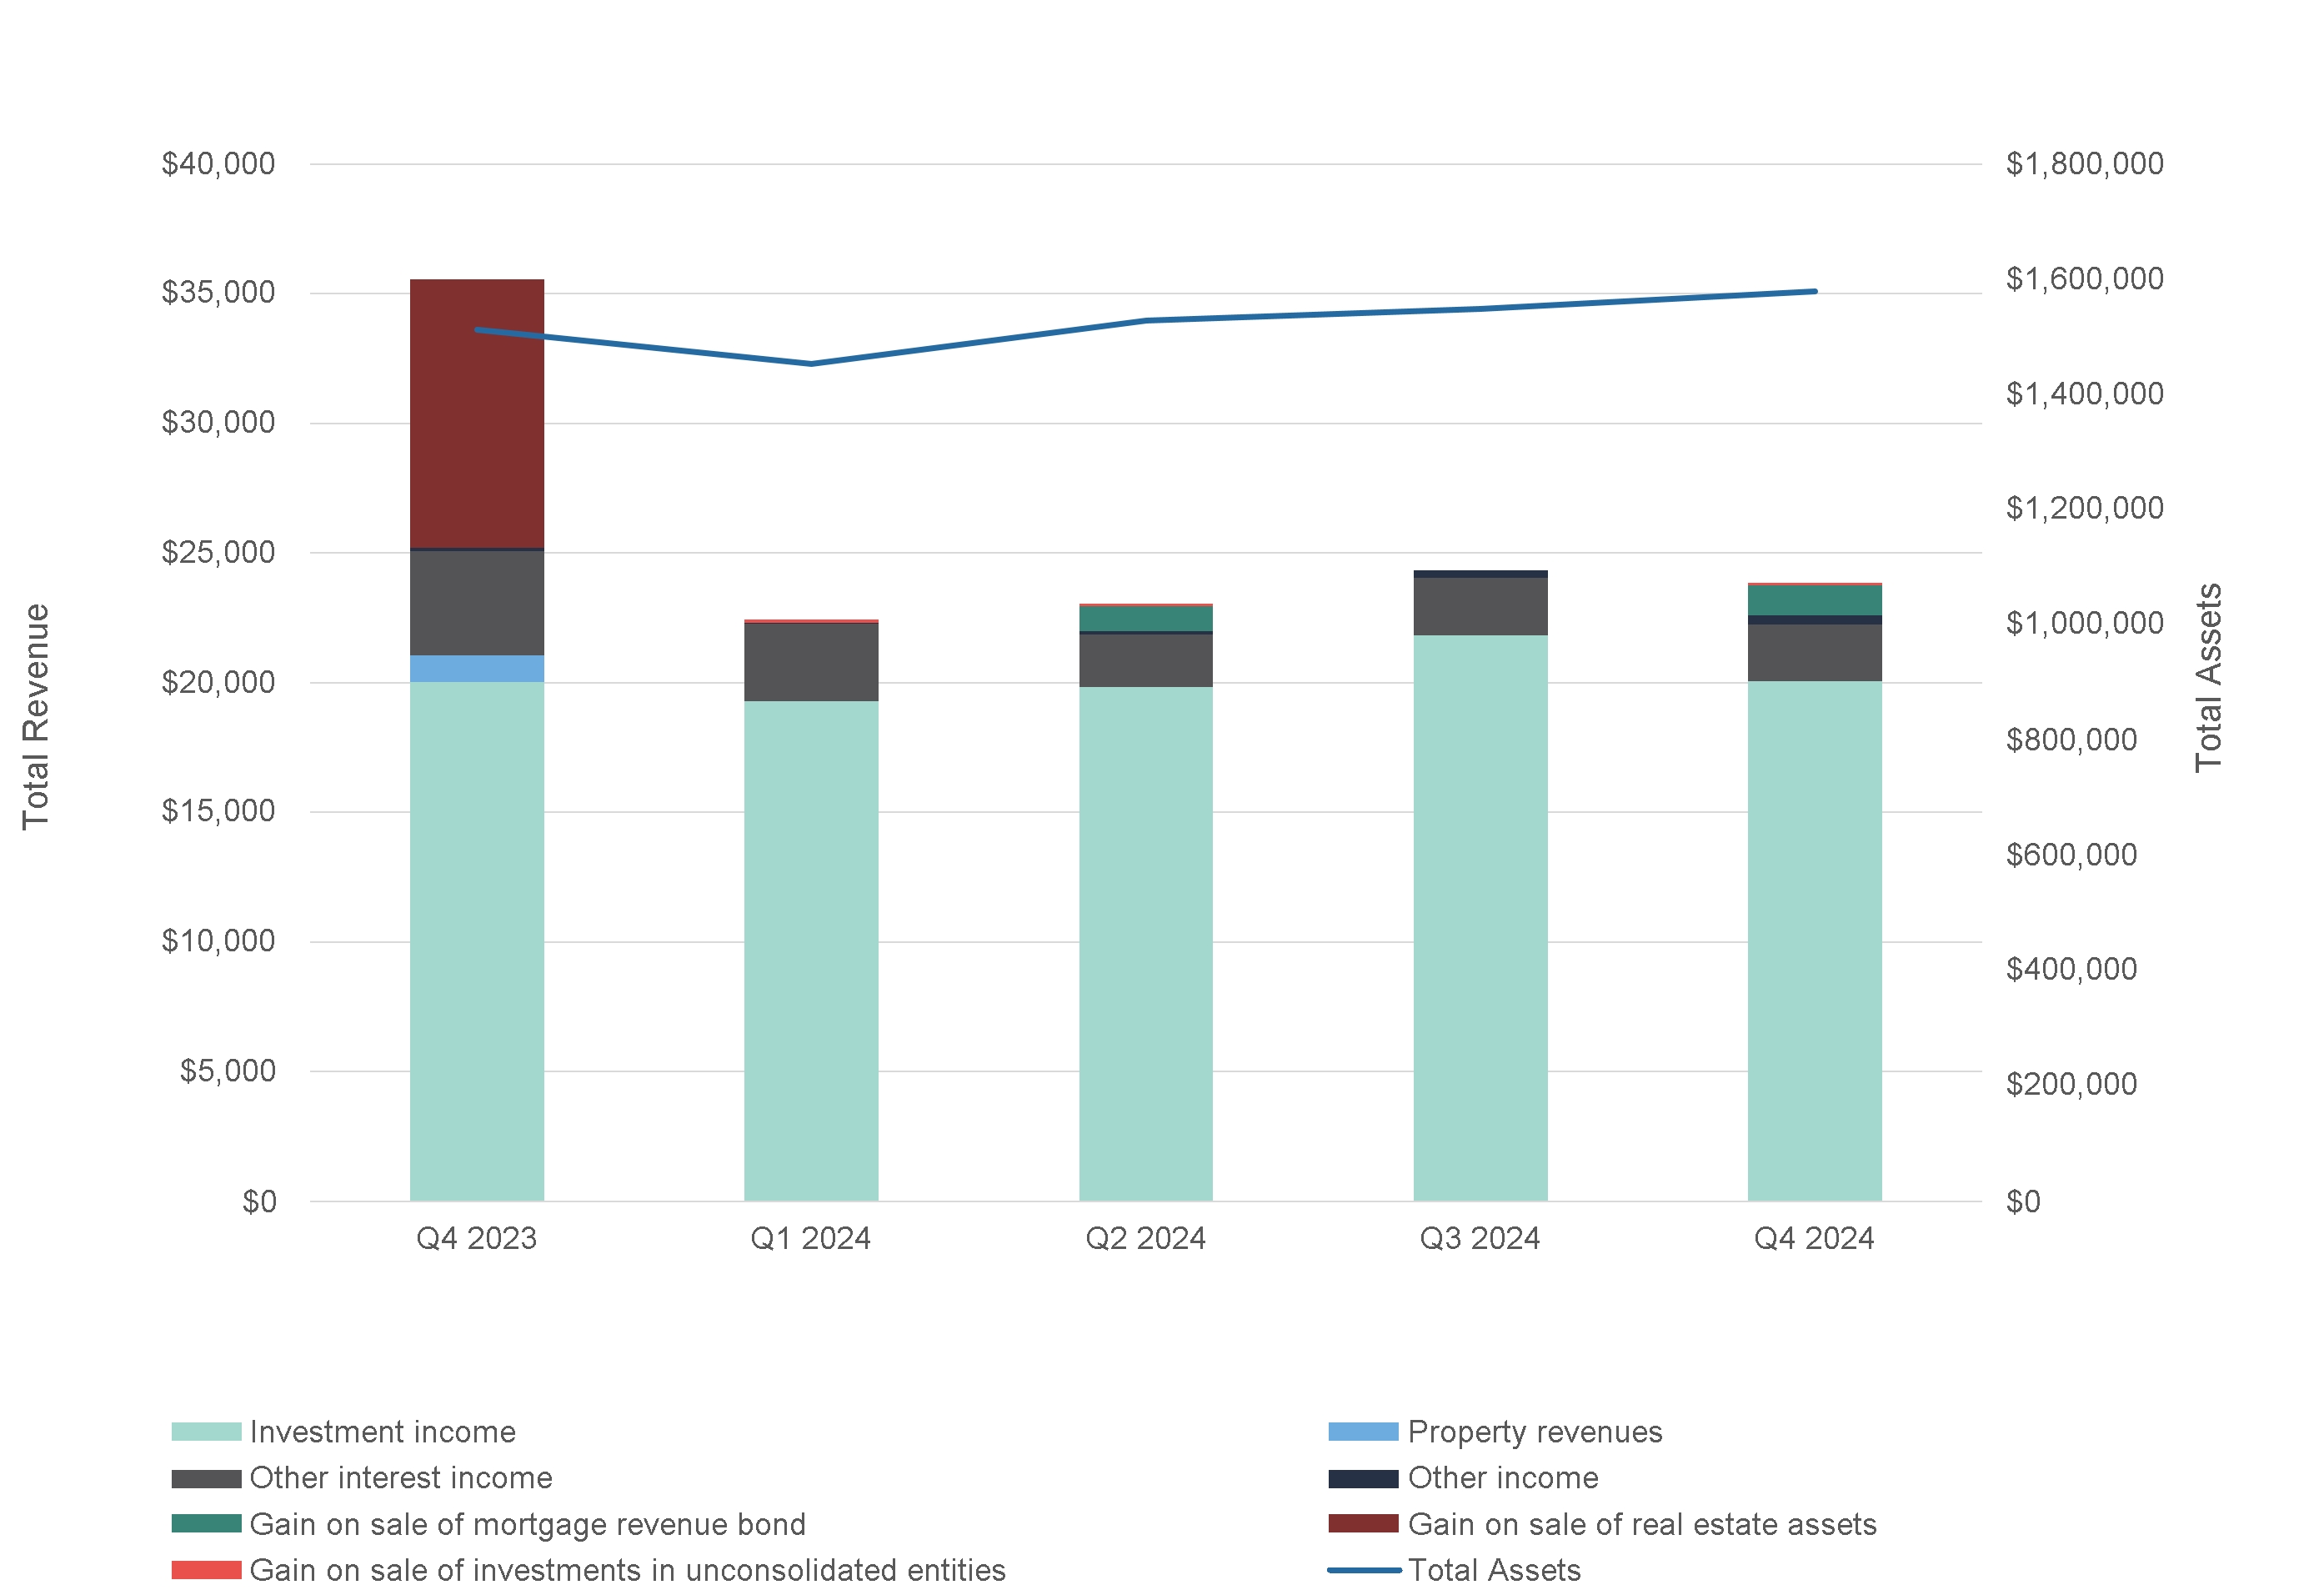
Total Revenue & Gain on Sale Trends
(Dollar amounts in thousands)
© 2025 Greystone & Co. II LLC |
|
Supplemental Financial Report for the Quarter Ended December 31, 2024 |
|
Operating Expense Trends
(Dollar amounts in thousands)
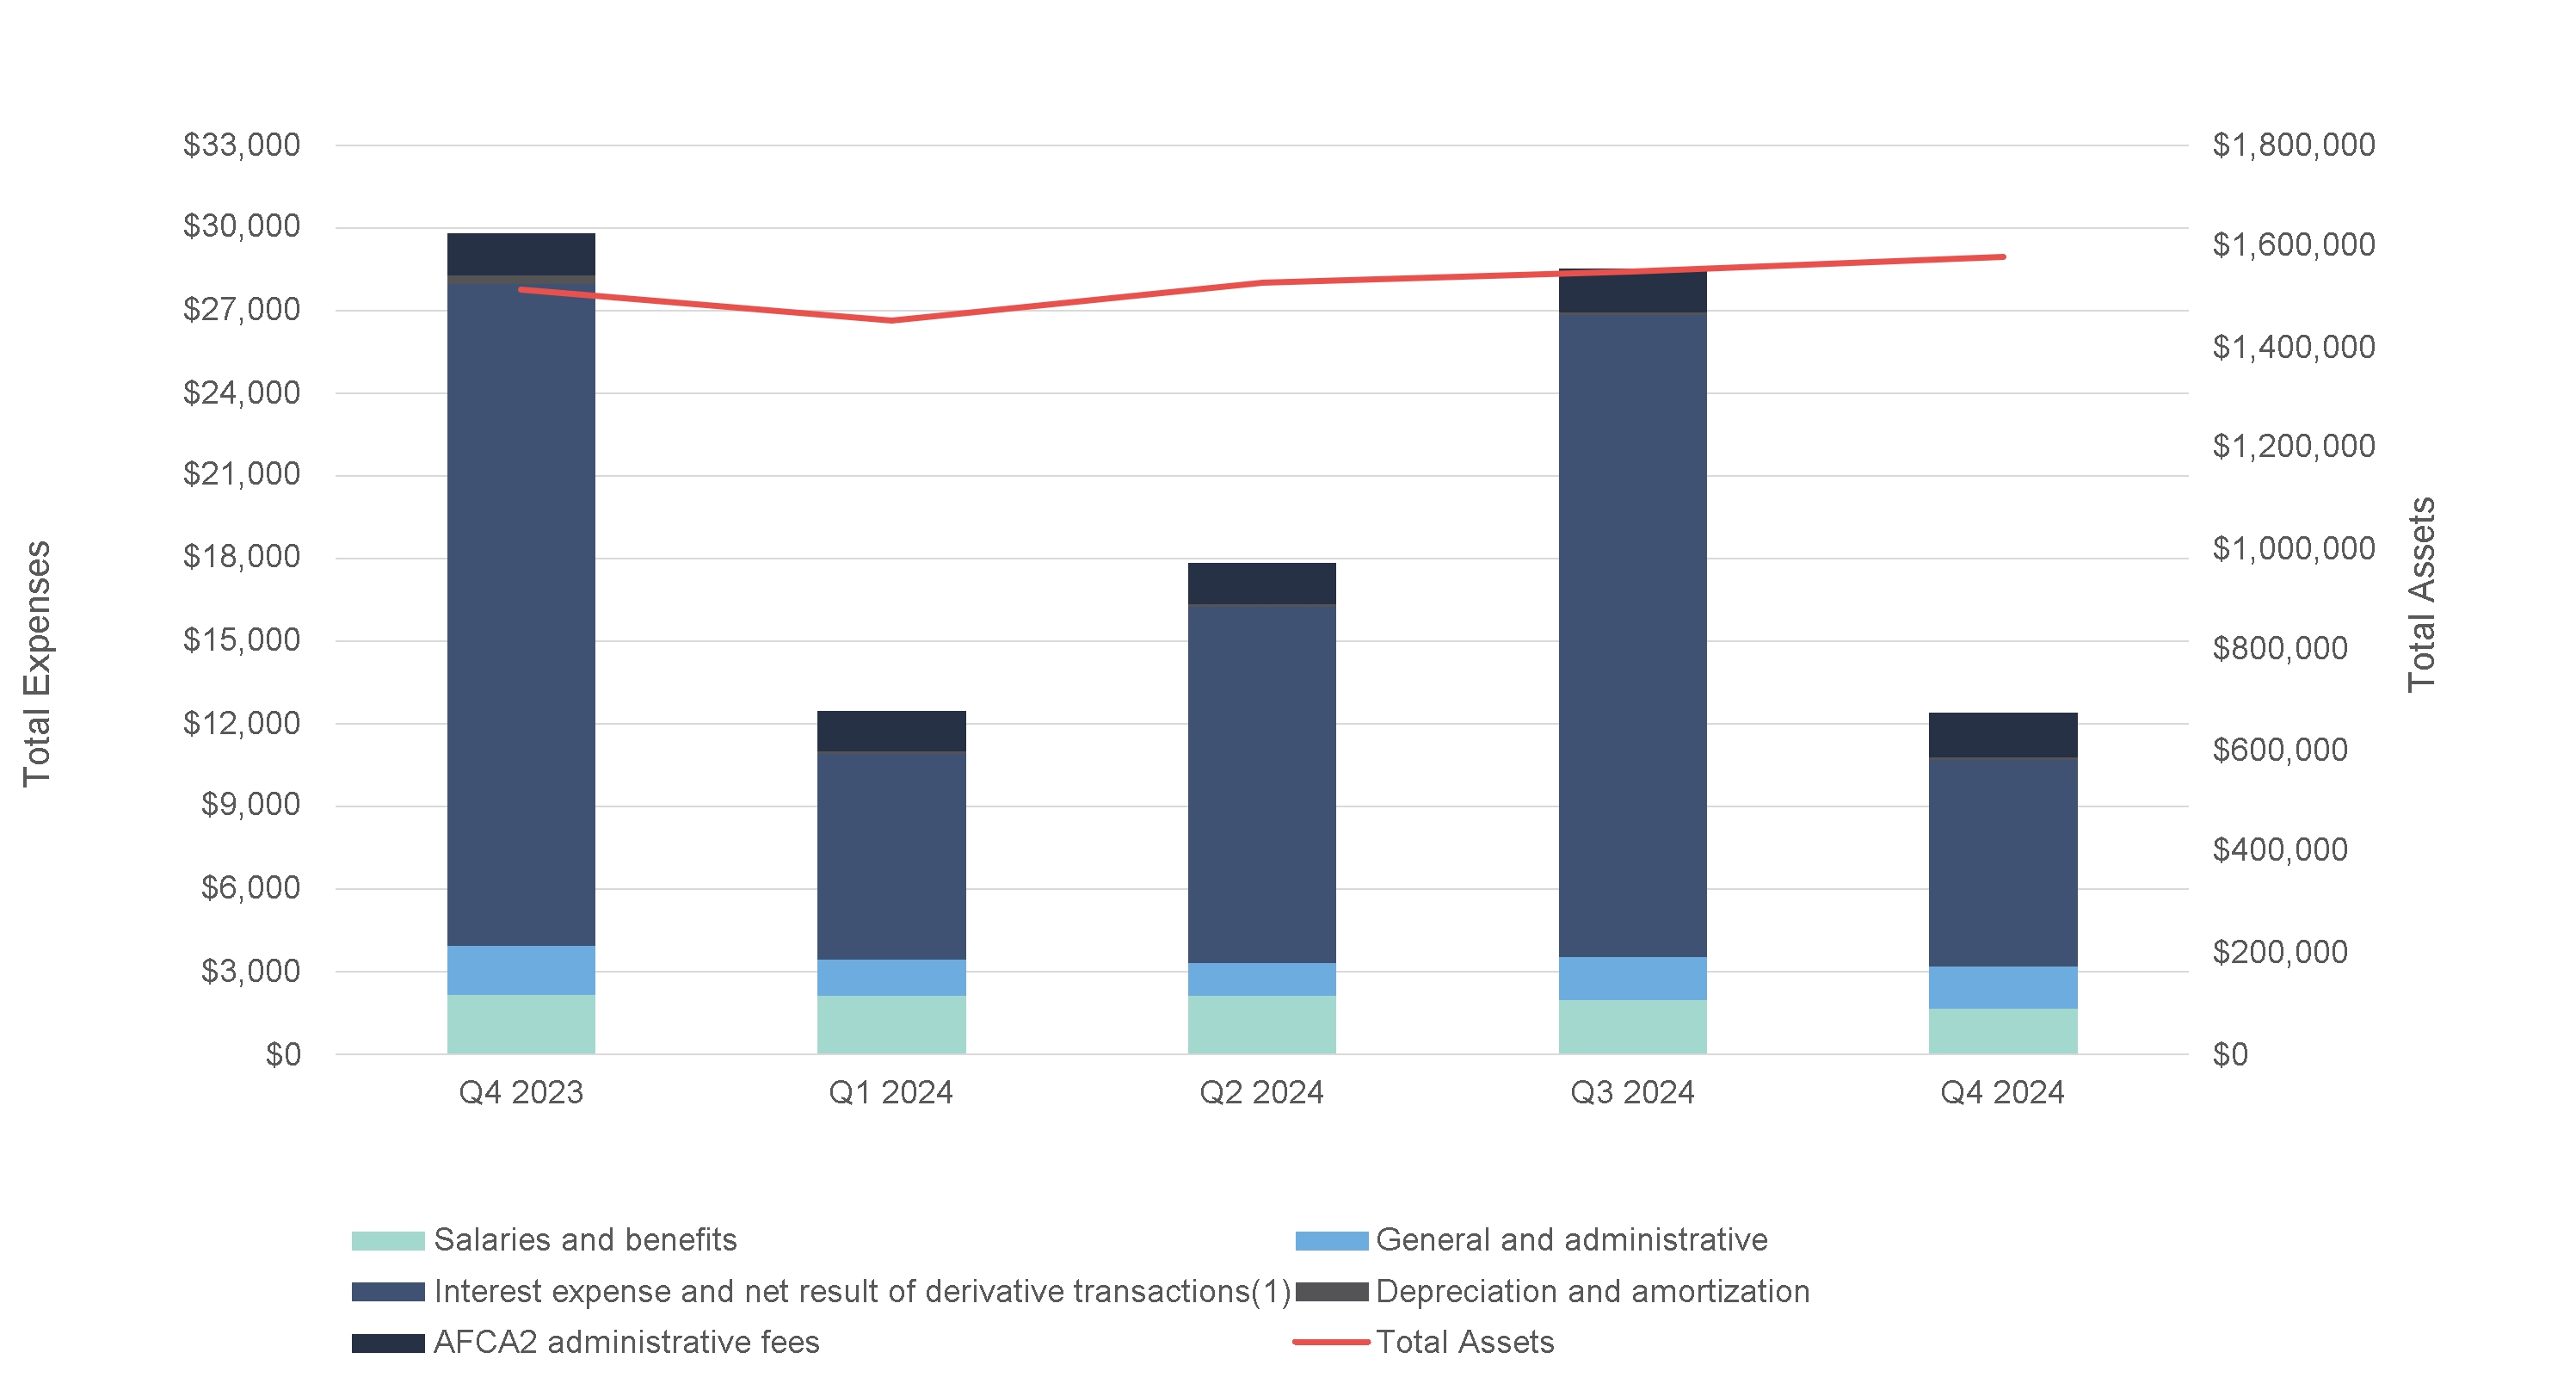
Since January 1, 2023, the sum of “Salaries and benefits” and “General and administrative” expenses as a percentage of Total Assets has
averaged approximately 0.24% per quarter.
© 2025 Greystone & Co. II LLC |
|
Supplemental Financial Report for the Quarter Ended December 31, 2024 |
|
Tax Income Information Related to Beneficial Unit Certificates
The following table summarizes tax-exempt and taxable income as percentages of total income allocated to the Partnership’s BUCs on Schedule K-1 for tax years 2022 to 2024. This disclosure relates only to income allocated to the Partnership’s BUCs and does not consider an individual unitholder’s basis in the BUCs or potential return of capital as such matters are dependent on the individual unitholders’ specific tax circumstances. The disclosure also assumes that the individual unitholder can utilize all allocated losses and deductions, even though such items may be limited depending on the unitholder’s specific tax circumstances. Such amounts are for all BUC holders in the aggregate during the year. Income is allocated to individual investors monthly and amounts allocated to individual investors may differ from these percentages due to, including, but not limited to, BUC purchases and sales activity and the timing of significant transactions during the year.
|
2024(1) |
|
2023 |
|
|
2022 |
|
|
||
Tax-exempt income |
n/a |
|
|
40 |
% |
|
|
25 |
% |
|
Taxable income |
n/a |
|
|
60 |
% |
|
|
75 |
% |
|
|
n/a |
|
|
100 |
% |
|
|
100 |
% |
|
Unrelated Business Taxable Income
Certain allocations of income and losses may be considered Unrelated Business Taxable Income (“UBTI”) for certain tax-exempt unitholders. UBTI-related items are reported in Box 20V and in the footnotes to each BUC holder’s Schedule K-1. The rules around UBTI are complex, so please consult your tax advisor.
© 2025 Greystone & Co. II LLC |
|
Supplemental Financial Report for the Quarter Ended December 31, 2024 |
|
Appendices
© 2025 Greystone & Co. II LLC |
|
Supplemental Financial Report for the Quarter Ended December 31, 2024 |
|
Operating Results Detail
(Dollar amounts in thousands, except per BUC information)
|
|
Q4 2023 |
|
|
Q1 2024 |
|
|
Q2 2024 |
|
|
Q3 2024 |
|
|
Q4 2024 |
|
|||||
Revenues: |
|
|
|
|
|
|
|
|
|
|
|
|
|
|
|
|||||
Investment income |
|
$ |
20,010 |
|
|
$ |
19,272 |
|
|
$ |
19,827 |
|
|
$ |
21,821 |
|
|
$ |
20,056 |
|
Other interest income |
|
|
4,079 |
|
|
|
3,004 |
|
|
|
2,071 |
|
|
|
2,235 |
|
|
|
2,200 |
|
Property revenues |
|
|
1,035 |
|
|
|
- |
|
|
|
- |
|
|
|
- |
|
|
|
- |
|
Other income |
|
|
61 |
|
|
|
95 |
|
|
|
71 |
|
|
|
289 |
|
|
|
330 |
|
Total revenues |
|
|
25,185 |
|
|
|
22,371 |
|
|
|
21,969 |
|
|
|
24,345 |
|
|
|
22,586 |
|
|
|
|
|
|
|
|
|
|
|
|
|
|
|
|
|
|||||
Expenses: |
|
|
|
|
|
|
|
|
|
|
|
|
|
|
|
|||||
Real estate operating (exclusive of items shown below) |
|
|
573 |
|
|
|
- |
|
|
|
- |
|
|
|
- |
|
|
|
- |
|
Provision for credit losses |
|
|
(466 |
) |
|
|
(806 |
) |
|
|
20 |
|
|
|
(226 |
) |
|
|
(24 |
) |
Depreciation and amortization |
|
|
314 |
|
|
|
6 |
|
|
|
6 |
|
|
|
6 |
|
|
|
6 |
|
Interest expense |
|
|
16,849 |
|
|
|
13,804 |
|
|
|
14,898 |
|
|
|
15,489 |
|
|
|
15,841 |
|
Net result from derivative transactions |
|
|
7,168 |
|
|
|
(6,268 |
) |
|
|
(1,885 |
) |
|
|
7,897 |
|
|
|
(8,240 |
) |
General and administrative |
|
|
4,889 |
|
|
|
4,931 |
|
|
|
4,821 |
|
|
|
5,113 |
|
|
|
4,788 |
|
Total expenses |
|
|
29,327 |
|
|
|
11,667 |
|
|
|
17,860 |
|
|
|
28,279 |
|
|
|
12,371 |
|
|
|
|
|
|
|
|
|
|
|
|
|
|
|
|
|
|||||
Other Income: |
|
|
|
|
|
|
|
|
|
|
|
|
|
|
|
|||||
Gain on sale of real estate assets |
|
|
10,363 |
|
|
|
- |
|
|
|
64 |
|
|
|
- |
|
|
|
- |
|
Gain on sale of mortgage revenue bonds |
|
|
- |
|
|
|
- |
|
|
|
1,012 |
|
|
|
- |
|
|
|
1,208 |
|
Gain on sale of investments in unconsolidated entities |
|
|
- |
|
|
|
50 |
|
|
|
7 |
|
|
|
- |
|
|
|
61 |
|
Earnings (losses) from investments in unconsolidated entities |
|
|
(18 |
) |
|
|
(107 |
) |
|
|
(15 |
) |
|
|
(704 |
) |
|
|
(1,315 |
) |
Income (loss) before income taxes |
|
|
6,203 |
|
|
|
10,647 |
|
|
|
5,177 |
|
|
|
(4,638 |
) |
|
|
10,169 |
|
Income tax expense (benefit) |
|
|
(1 |
) |
|
|
(1 |
) |
|
|
(1 |
) |
|
|
(2 |
) |
|
|
36 |
|
Net income (loss) |
|
|
6,204 |
|
|
|
10,648 |
|
|
|
5,178 |
|
|
|
(4,636 |
) |
|
|
10,133 |
|
Redeemable preferred unit distributions and accretion |
|
|
(623 |
) |
|
|
(767 |
) |
|
|
(741 |
) |
|
|
(741 |
) |
|
|
(741 |
) |
Net income (loss) available to partners |
|
$ |
5,581 |
|
|
$ |
9,881 |
|
|
$ |
4,437 |
|
|
$ |
(5,377 |
) |
|
$ |
9,392 |
|
|
|
|
|
|
|
|
|
|
|
|
|
|
|
|
|
|||||
Net income (loss) available to partners allocated to: |
|
|
|
|
|
|
|
|
|
|
|
|
|
|
|
|||||
General partner |
|
$ |
75 |
|
|
$ |
98 |
|
|
$ |
44 |
|
|
$ |
(54 |
) |
|
$ |
391 |
|
Limited partners - BUCs |
|
|
5,472 |
|
|
|
9,725 |
|
|
|
4,324 |
|
|
|
(5,399 |
) |
|
|
8,938 |
|
Limited partners - Restricted units |
|
|
34 |
|
|
|
58 |
|
|
|
69 |
|
|
|
76 |
|
|
|
63 |
|
Net income (loss) available to partners |
|
$ |
5,581 |
|
|
$ |
9,881 |
|
|
$ |
4,437 |
|
|
$ |
(5,377 |
) |
|
$ |
9,392 |
|
© 2025 Greystone & Co. II LLC |
|
Supplemental Financial Report for the Quarter Ended December 31, 2024 |
|
Cash Available for Distribution (1)
(Dollar amounts in thousands, except per BUC information)
|
|
Q4 2023 |
|
|
Q1 2024 |
|
|
Q2 2024 |
|
|
Q3 2024 |
|
|
Q4 2024 |
|
|
|||||
Net income (loss) |
|
$ |
6,204 |
|
|
$ |
10,648 |
|
|
$ |
5,178 |
|
|
$ |
(4,636 |
) |
|
$ |
10,133 |
|
|
Unrealized (gains) losses on derivatives, net |
|
|
9,994 |
|
|
|
(4,604 |
) |
|
|
(211 |
) |
|
|
9,695 |
|
|
|
(6,979 |
) |
|
Depreciation and amortization expense |
|
|
314 |
|
|
|
6 |
|
|
|
6 |
|
|
|
6 |
|
|
|
6 |
|
|
Provision for credit losses |
|
|
(466 |
) |
|
|
(806 |
) |
|
|
189 |
|
|
|
(226 |
) |
|
|
(24 |
) |
|
Reversal of gain on sale of real estate assets |
|
|
(10,363 |
) |
|
|
- |
|
|
|
- |
|
|
|
- |
|
|
|
- |
|
|
Amortization of deferred financing costs |
|
|
710 |
|
|
|
367 |
|
|
|
460 |
|
|
|
360 |
|
|
|
466 |
|
|
Restricted unit compensation expense |
|
|
473 |
|
|
|
332 |
|
|
|
558 |
|
|
|
565 |
|
|
|
436 |
|
|
Deferred income taxes |
|
|
3 |
|
|
|
3 |
|
|
|
(1 |
) |
|
|
(1 |
) |
|
|
1 |
|
|
Redeemable Preferred Unit distributions and accretion |
|
|
(623 |
) |
|
|
(767 |
) |
|
|
(741 |
) |
|
|
(741 |
) |
|
|
(741 |
) |
|
Tier 2 Income allocable to the General Partner |
|
|
(19 |
) |
|
|
- |
|
|
|
- |
|
|
|
- |
|
|
|
(310 |
) |
|
Recovery of prior credit loss |
|
|
(17 |
) |
|
|
(17 |
) |
|
|
(17 |
) |
|
|
(17 |
) |
|
|
(17 |
) |
|
Bond premium, discount and amortization, net of cash received |
|
|
(43 |
) |
|
|
(40 |
) |
|
|
879 |
|
|
|
499 |
|
|
|
(91 |
) |
|
(Earnings) losses from investments in unconsolidated entities |
|
|
18 |
|
|
|
107 |
|
|
|
15 |
|
|
|
704 |
|
|
|
1,315 |
|
|
Total Cash Available for Distribution |
|
$ |
6,185 |
|
|
$ |
5,229 |
|
|
$ |
6,315 |
|
|
$ |
6,208 |
|
|
$ |
4,195 |
|
|
|
|
|
|
|
|
|
|
|
|
|
|
|
|
|
|
|
|||||
Weighted average number of BUCs outstanding, basic |
|
|
22,852,500 |
|
|
|
23,000,754 |
|
|
|
23,083,387 |
|
|
|
23,085,261 |
|
|
|
23,115,162 |
|
|
Net income (loss) per BUC, basic |
|
$ |
0.24 |
|
|
$ |
0.42 |
|
|
$ |
0.19 |
|
|
$ |
(0.23 |
) |
|
$ |
0.39 |
|
|
Total CAD per BUC, basic |
|
$ |
0.27 |
|
|
$ |
0.23 |
|
|
$ |
0.27 |
|
|
$ |
0.27 |
|
|
$ |
0.18 |
|
|
Cash Distributions declared, per BUC |
|
$ |
0.37 |
|
|
$ |
0.37 |
|
|
$ |
0.37 |
|
|
$ |
0.37 |
|
|
$ |
0.37 |
|
|
BUCs Distributions declared, per BUC (2) |
|
$ |
0.07 |
|
|
$ |
0.07 |
|
|
$ |
- |
|
|
$ |
- |
|
|
$ |
- |
|
|
|
|
|
|
|
|
|
|
|
|
|
|
|
|
|
|
|
|||||
|
|
|
|
|
Trailing five quarter totals: |
|
|
||||||||||||||
|
|
|
|
|
Net income per BUC, basic |
|
|
$ |
1.01 |
|
|
||||||||||
|
|
|
|
|
Total CAD per BUC, basic |
|
|
$ |
1.22 |
|
|
||||||||||
|
|
|
|
|
Cash Distributions declared, per BUC |
|
|
$ |
1.85 |
|
|
||||||||||
|
|
|
|
|
BUCs Distributions declared, per BUC |
|
|
$ |
0.14 |
|
|
||||||||||
|
|
|
|
|
|
||||||||||||||||
© 2025 Greystone & Co. II LLC |
|
Supplemental Financial Report for the Quarter Ended December 31, 2024 |
|
Balance Sheet Summary
(Dollar amounts in thousands, except per BUC information)
|
|
12/31/2023 |
|
|
3/31/2024 |
|
|
6/30/2024 |
|
|
9/30/2024 |
|
|
12/31/2024 |
|
|||||
Assets: |
|
|
|
|
|
|
|
|
|
|
|
|
|
|
|
|||||
Cash |
|
$ |
37,918 |
|
|
$ |
56,255 |
|
|
$ |
34,036 |
|
|
$ |
37,374 |
|
|
$ |
14,703 |
|
Restricted cash |
|
|
9,816 |
|
|
|
14,672 |
|
|
|
16,861 |
|
|
|
10,446 |
|
|
|
16,603 |
|
Interest receivable |
|
|
8,266 |
|
|
|
7,847 |
|
|
|
7,193 |
|
|
|
7,104 |
|
|
|
7,446 |
|
Mortgage revenue bonds, at fair value |
|
|
930,676 |
|
|
|
942,746 |
|
|
|
1,002,052 |
|
|
|
1,032,891 |
|
|
|
1,026,484 |
|
Governmental issuer loans, net |
|
|
221,653 |
|
|
|
204,391 |
|
|
|
213,446 |
|
|
|
205,639 |
|
|
|
225,164 |
|
Property loans, net |
|
|
120,508 |
|
|
|
51,678 |
|
|
|
61,358 |
|
|
|
53,835 |
|
|
|
55,135 |
|
Investments in unconsolidated entities |
|
|
136,653 |
|
|
|
145,131 |
|
|
|
157,941 |
|
|
|
168,743 |
|
|
|
179,410 |
|
Real estate assets, net |
|
|
4,716 |
|
|
|
4,716 |
|
|
|
4,716 |
|
|
|
4,716 |
|
|
|
4,906 |
|
Other assets |
|
|
43,195 |
|
|
|
25,983 |
|
|
|
31,038 |
|
|
|
28,501 |
|
|
|
49,849 |
|
Total assets |
|
$ |
1,513,401 |
|
|
$ |
1,453,419 |
|
|
$ |
1,528,641 |
|
|
$ |
1,549,249 |
|
|
$ |
1,579,700 |
|
|
|
|
|
|
|
|
|
|
|
|
|
|
|
|
|
|||||
Liabilities |
|
|
|
|
|
|
|
|
|
|
|
|
|
|
|
|||||
Accounts payable, accrued expenses and other liabilities |
|
$ |
22,958 |
|
|
$ |
20,863 |
|
|
$ |
21,215 |
|
|
$ |
24,724 |
|
|
$ |
23,481 |
|
Distribution payable |
|
|
8,584 |
|
|
|
8,672 |
|
|
|
8,704 |
|
|
|
8,704 |
|
|
|
8,997 |
|
Secured lines of credit |
|
|
33,400 |
|
|
|
16,500 |
|
|
|
41,250 |
|
|
|
44,400 |
|
|
|
68,852 |
|
Debt financing, net |
|
|
1,015,030 |
|
|
|
978,475 |
|
|
|
1,052,526 |
|
|
|
1,062,408 |
|
|
|
1,093,273 |
|
Mortgages payable, net |
|
|
1,690 |
|
|
|
1,690 |
|
|
|
1,690 |
|
|
|
1,690 |
|
|
|
1,664 |
|
Total liabilities |
|
|
1,081,662 |
|
|
|
1,026,200 |
|
|
|
1,125,385 |
|
|
|
1,141,926 |
|
|
|
1,196,267 |
|
|
|
|
|
|
|
|
|
|
|
|
|
|
|
|
|
|||||
Redeemable preferred units |
|
|
82,432 |
|
|
|
87,389 |
|
|
|
77,395 |
|
|
|
77,401 |
|
|
|
77,406 |
|
Partners' capital |
|
|
349,307 |
|
|
|
339,830 |
|
|
|
325,861 |
|
|
|
329,922 |
|
|
|
306,027 |
|
Total liabilities and partners' capital |
|
$ |
1,513,401 |
|
|
$ |
1,453,419 |
|
|
$ |
1,528,641 |
|
|
$ |
1,549,249 |
|
|
$ |
1,579,700 |
|
|
|
|
|
|
|
|
|
|
|
|
|
|
|
|
|
|||||
Net book value per BUC(1) |
|
$ |
15.17 |
|
|
$ |
14.59 |
|
|
$ |
13.98 |
|
|
$ |
14.15 |
|
|
$ |
13.15 |
|
© 2025 Greystone & Co. II LLC |
|
Supplemental Financial Report for the Quarter Ended December 31, 2024 |
|
Important Disclosure Notices
Forward-Looking Statements
All statements in this document other than statements of historical facts, including statements regarding our future results of operations and financial position, business strategy and plans and objectives of management for future operations, are forward-looking statements. When used, statements which are not historical in nature, including those containing words such as “anticipate,” “estimate,” “should,” “expect,” “believe,” “intend,” and similar expressions, are intended to identify forward-looking statements. We have based forward-looking statements largely on our current expectations and projections about future events and financial trends that we believe may affect our business, financial condition and results of operations. This document may also contain estimates and other statistical data made by independent parties and by us relating to market size and growth and other industry data. This data involves a number of assumptions and limitations, and you are cautioned not to give undue weight to such estimates. We have not independently verified the statistical and other industry data generated by independent parties contained in this supplement and, accordingly, we cannot guarantee their accuracy or completeness. In addition, projections, assumptions and estimates of our future performance and the future performance of the industries in which we operate are necessarily subject to a high degree of uncertainty and risk due to a variety of factors, including those described under the headings “Item 1A Risk Factors” in our 2024 Annual Report on Form 10-K for the year ended December 31, 2024. These forward-looking statements are subject to various risks and uncertainties and Greystone Housing Impact Investors LP (the “Partnership”) expressly disclaims any obligation to publicly update or revise any forward-looking statements, whether as a result of new information, future events or otherwise.
Most, but not all, of the selected financial information furnished herein is derived from the Greystone Housing Impact Investors LP’s consolidated financial statements and related notes prepared in conformity with generally accepted accounting principles in the United States of America (“GAAP”) and management’s discussion and analysis of financial condition and results of operations included in the Partnership’s reports on Forms 10-K and 10-Q. The Partnership’s annual consolidated financial statements were subject to an independent audit, dated February 20, 2025.
Disclosure Regarding Non-GAAP Measures
This document refers to certain financial measures that are identified as non-GAAP. We believe these non-GAAP measures are helpful to investors because they are the key information used by management to analyze our operations. This supplemental information should not be considered in isolation or as a substitute for the related GAAP measures.
Please see the consolidated financial statements we filed with the Securities and Exchange Commission on Forms 10-K and 10-Q. Our GAAP consolidated financial statements can be located upon searching for the Partnership’s filings at www.sec.gov.
Other Information
On September 13, 2023, the Partnership declared a supplemental distribution payable in the form of additional BUCs equal to $0.07 per BUC (the “Third Quarter 2023 BUCs Distribution”). The Third Quarter 2023 BUCs Distribution was paid at a ratio of 0.00418 BUCs for each issued and outstanding BUC as of the record date of September 29, 2023, which represents an amount per BUC based on the closing price of the BUCs on the NYSE on September 12, 2023. The Third Quarter 2023 BUCs Distribution was completed on October 31, 2023.
© 2025 Greystone & Co. II LLC |
|
Supplemental Financial Report for the Quarter Ended December 31, 2024 |
|
On December 13, 2023, the Partnership declared a supplemental distribution payable in the form of additional BUCs equal to $0.07 per BUC (the “Fourth Quarter 2023 BUCs Distribution”). The Fourth Quarter 2023 BUCs Distribution was paid at a ratio of 0.00415 BUCs for each issued and outstanding BUC as of the record date of December 29, 2023, which represents an amount per BUC based on the closing price of the BUCs on the NYSE on December 12, 2023. The Fourth Quarter 2023 BUCs Distribution was completed on January 31, 2024.
On March 13, 2024, the Partnership declared a supplemental distribution payable in the form of additional BUCs equal to $0.07 per BUC (the “First Quarter 2024 BUCs Distribution”, collectively with the Third Quarter 2023 BUCs Distribution, and the Fourth Quarter 2023 BUCs Distribution, the “BUCs Distributions”). The First Quarter 2024 BUCs Distribution was paid at a ratio of 0.00417 BUCs for each issued and outstanding BUC as of the record date of March 28, 2024, which represents an amount per BUC based on the closing price of the BUCs on the NYSE on March 12, 2024. The First Quarter 2024 BUCs Distribution was completed on April 30, 2024.
There were no fractional BUCs issued in connection with the BUCs Distributions. All fractional BUCs resulting from the BUCs Distributions received cash for such fraction based on the market value of the BUCs on the record date.
Unless noted otherwise herein, the BUCs Distributions have been applied retroactively to all net income per BUC, distributions per BUC and similar per BUC disclosures for all periods indicated in this supplemental financial report.
© 2025 Greystone & Co. II LLC |
|
Supplemental Financial Report for the Quarter Ended December 31, 2024 |
|
Other Partnership Information
Corporate Office: |
|
|
Transfer Agent:
|
|
14301 FNB Parkway |
|
|
Equiniti Trust Company, LLC |
|
Suite 211 |
|
|
48 Wall Street, Floor 23 |
|
Omaha, NE 68154 |
|
|
New York, NY 10005 |
|
Phone: |
402-952-1235 |
|
HelpAST@equiniti.com |
|
Investor & K-1 Services: |
855-428-2951 |
|
Phone: 718-921-8124 |
|
Web Site: |
www.ghiinvestors.com |
|
800-937-5449 |
|
K-1 Services Email: |
ghiK1s@greyco.com |
|
|
|
Ticker Symbol (NYSE): |
GHI |
|
|
|
Corporate Counsel: |
|
Independent Accountants: |
Barnes & Thornburg LLP |
|
PwC |
11 S. Meridian Street |
|
1 North Wacker Drive |
Indianapolis, IN 46204 |
|
Chicago, Illinois 60606 |
|
|
|
Board of Managers of Greystone AF Manager LLC: |
||
(acting as the directors of Greystone Housing Impact Investors LP) |
||
|
|
|
Stephen Rosenberg |
Chairman of the Board |
|
Jeffrey M. Baevsky |
Manager |
|
Drew C. Fletcher |
Manager |
|
Steven C. Lilly |
Manager |
|
W. Kimball Griffith |
Manager |
|
Deborah A. Wilson |
Manager |
|
Robert K. Jacobsen |
Manager |
|
|
|
|
Corporate Officers: |
||
Kenneth C. Rogozinski |
Chief Executive Officer |
|
Jesse A. Coury |
Chief Financial Officer |
|
© 2025 Greystone & Co. II LLC |
|


 2
2