

Supplemental Financial Report for
Quarter Ended March 31, 2016

AMERICA FIRST MULTIFAMILY INVESTORS, L.P.
All statements in this document other than statements of historical facts, including statements regarding our future results of operations and financial position, business strategy and plans and objectives of management for future operations, are forward-looking statements. When used, statements which are not historical in nature, including those containing words such as “anticipate,” “estimate,” “should,” “expect,” “believe,” “intend,” and similar expressions, are intended to identify forward-looking statements. We have based forward-looking statements largely on our current expectations and projections about future events and financial trends that we believe may affect our business, financial condition and results of operations. This document may also contain estimates and other statistical data made by independent parties and by us relating to market size and growth and other industry data. This data involves a number of assumptions and limitations, and you are cautioned not to give undue weight to such estimates. We have not independently verified the statistical and other industry data generated by independent parties contained in this supplement and, accordingly, we cannot guarantee their accuracy or completeness. In addition, projections, assumptions and estimates of our future performance and the future performance of the industries in which we operate are necessarily subject to a high degree of uncertainty and risk due to a variety of factors, including those described under the headings “Item 1A. Risk Factors” beginning on page 11 of our Annual Report on Form 10-K for the year ended December 31, 2015 and beginning on page 49 of our Form 10-Q for the quarter ended March 31, 2016. These forward-looking statements are subject to various risks and uncertainties and America First Multifamily Investors, L.P. expressly disclaims any obligation to publicly update or revise any forward-looking statements, whether as a result of new information, future events or otherwise.
Most, but not all, of the selected financial information furnished herein is derived from the America First Multifamily Investors, L.P.’s (“ATAX” or “Partnership”) consolidated financial statements and related notes prepared in accordance with GAAP and management’s discussion and analysis of financial condition and results of operations included in the Partnership’s reports on Forms 10-K and 10-Q. The Partnership’s annual consolidated financial statements were subject to independent audit, dated March 3, 2016. The 10-Q materials are dated May 2, 2016 and the Partnership does not undertake to update the materials after that date.
Disclosure Regarding Non-GAAP Measures
This document refers to certain financial measures that are identified as non-GAAP. We believe these non-GAAP measures are helpful to investors because they are the key information used by management to analyze our operations. This supplemental information should not be considered in isolation or as a substitute for the related GAAP measures.
Please see the consolidated financial statements we filed with the Securities and Exchange Commission on Forms 10-Ks and 10-Qs which include a reconciliation of the Partnership to consolidated financial statements in the capital and liquidity section. Our GAAP consolidated financial statements can be located upon searching for the Partnership’s filings at www.sec.gov.
PARTNERSHIP FINANCIAL INFORMATION
|
TABLE OF CONTENTS |
Pages |
|
|
|
Supplemental Letter From the CEO |
4-5 |
|
|
Quarterly Fact Sheet |
6 |
|
|
Financial Performance Trend Graphs |
7-9 |
|
|
Key Facts about America First Multifamily Investors, LP |
10 |
|
|
Partnership Financial Statements |
11-13 |
|
|
Partnership Financial Measures |
14-16 |
|
|
Occupancy Data |
17-18 |
AMERICA FIRST MULTIFAMILY INVESTORS L.P.
SUPPLEMENTAL LETTER FROM THE CEO
The first quarter of 2016 was stable for us. We are pleased by the results of our operations, the net income we have reported, and our Cash Available for Distribution (“CAD”).
Highlights of our first quarter of 2016 results, compared to the first quarter of 2015, are as follows:
|
|
• |
Total revenue increased to $14.9 million, from $12.5 million |
|
|
|
• |
Net Income remained consistent at $2.5 million |
|
|
|
• |
Ratio of debt to total assets at par and cost increased to 64%, compared to 61% |
|
|
|
• |
CAD increased to $6.3 million ($0.10 per unit), compared to $5.4 million ($0.09 per unit) |
|
The notable transactions for the first quarter of 2016 that contributed to the $0.10 CAD per unit were:
|
|
• |
Purchased one mortgage revenue bond for approximately $11.5 million par value which is collateralized by a 180-unit multifamily residential property, |
|
|
|
• |
Sold one mortgage revenue bond for approximately $9.5 million, which approximated its carrying value plus accrued interest, |
|
|
|
• |
Sold the three remaining MBS Securities for approximately $15.1 million, which approximates the outstanding amortized cost plus interest, and eliminated the MBS Securities segment, |
|
|
|
• |
Terminated the $11.0 million derivative hedging the MBS Tender Option Bond (“TOB”) financing facility resulting in no gain or loss which was completed in conjunction with the sale of the remaining MBS Securities, and |
|
|
|
• |
Raised $10 million in capital related to the sale of the Series A Preferred Units which are redeemable. |
|
We have strengthened the performance of the fund and continued to enhance our relationships with our business partners and Unitholders. This has allowed us to report positive results in CAD.
We are very proud of our history of paying distributions to our Unitholders. For the past 30 years, the general partner of the general partner of ATAX has remained committed to paying distributions to the Unitholders of our Partnership. We have not missed a regularly scheduled distribution since we were listed as a publicly traded company on the NASDAQ market in 1986.
As a management team, we remain disciplined in our investment strategy and diligent in pursuit of market opportunities as they present themselves.
|
|
4 |
|
It has been a privilege to work with the many skilled and dedicated members of our Partnership team and an experienced team that comprise our Board of Managers. We are encouraged by the Partnership’s direction and look forward to discussing our first quarter of 2016 results in the near future.

Chad Daffer, Chief Executive Officer
|
|
5 |
|
|
Partnership Details |
|
||
|
(As of March 31, 2016) |
|
||
|
Symbol (NASDAQ) |
ATAX |
|
|
|
Annual Distribution |
$ |
0.50 |
|
|
Price |
$ |
5.25 |
|
|
Yield |
|
9.5 |
% |
|
|
|
|
|
|
Units Outstanding |
|
60,252,928 |
|
|
Market Capitalization |
$ |
316,327,872 |
|
|
52 week range of stock price |
$ |
4.51 to $5.76 |
|
|
|
|
|
|
|
Partnership Financial Information for the Quarter Ended March 31, 2016 |
|
||
|
(amounts in thousands, except per unit) |
|
|
|
|
|
|
|
|
|
Total Revenue |
$ |
14,928 |
|
|
Net Income - ATAX |
$ |
2,532 |
|
|
Cash Available for Distribution ("CAD")1 |
$ |
6,289 |
|
|
Total Assets |
$ |
874,453 |
|
|
Ratio of Debt To Total Assets at Par and Cost |
|
64 |
% |
|
|
|
|
|
|
CAD, per unit |
$ |
0.10 |
|
|
|
|
|
|
|
Distribution Declared per unit2 |
$ |
0.125 |
|
We were formed for the primary purpose of acquiring a portfolio of mortgage revenue bonds that are issued to provide construction and/or permanent financing of multifamily residential properties. We expect most of the interest paid on these bonds is excludable from gross income for federal income tax purposes. Our business objectives are to (i) preserve and protect our capital, (ii) provide regular cash distributions, and (iii) generate additional returns from appreciation of real estate or the opportunistic sale of the asset investments to our Unitholders. We also invest in other securities which 1) must be rated in one of the four highest rating categories by at least one nationally recognized securities rating agency and 2) cannot be more than 25% of our total assets at acquisition. We have also acquired interests in multifamily apartments (“MF Properties”) in order to position ourselves for future investments in mortgage revenue bonds issued to finance these properties.
|
|
1) |
Management utilizes a calculation of Cash Available for Distribution (“CAD”) as a means to determine the our ability to make distributions to Unitholders. This is a non-GAAP financial measure and on page 14 of the Supplement, GAAP Partnership net income is reconciled to CAD. |
|
|
|
2) |
The most recent distribution was paid on April 29, 2016 for Unit holders of record as of March 31, 2016. The distribution is payable to Unit holders of record as of the last business day of the quarter month end and ATAX trades ex-dividend two days prior to the record date with a payable date of the last business day of the subsequent month. |
|
|
|
6 |
|
|
|
• |
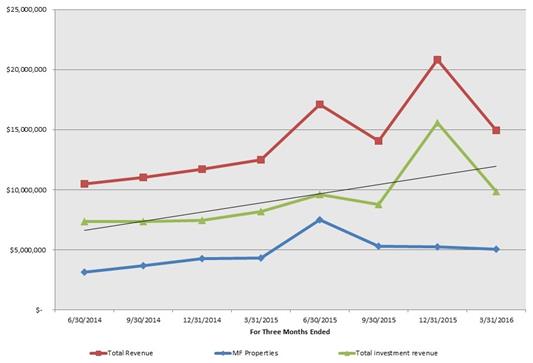
Revenue has increased due to our acquisition of mortgage revenue bonds. The trend line represents the trajectory of total investment revenue. |
|
|
|
• |
Highlighted transactions recorded during the past eight quarters include the following: |
|
|
|
• |
During the first quarter of 2016, we recognized contingent interest income of approximately $174,000. |
|
|
|
• |
During the fourth quarter of 2015, we recognized contingent interest and note interest income of approximately $6.2 million as a result of the sale of the Consolidated VIEs. |
|
|
|
• |
During the third quarter of 2015, we recognized a gain of approximately $1.2 million on the sale of Glynn Place, an MF Property. |
|
|
|
• |
During the second quarter of 2015, we recognized a gain of approximately $3.4 million on the sale of The Colonial, an MF Property. |
|
|
|
• |
During the third quarter of 2014, we recognized approximately $188,000 of guarantee fee income related to the Greens Property. |
|
|
|
• |
During the second quarter of 2014, we sold the Autumn Pines mortgage revenue bond and recognized a gain of approximately $873,000. |
|
PARTNERSHIP INCOME STATEMENT TRENDS – REVENUES
|
|
7 |
|
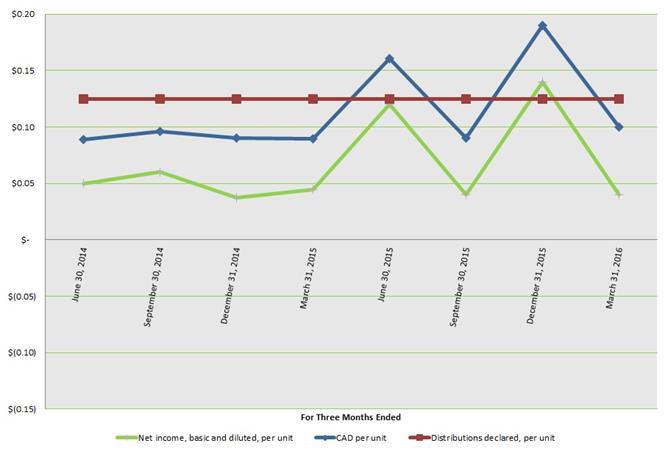
PERFORMANCE TRENDS
|
|
• |
In general, CAD1 has remained relatively consistent over the past eight quarters absent the contribution from highlighted transactional events. |
|
|
|
• |
In Q1 2016, we realized approximately $174,000 of contingent interest and 25% of Tier 2 income due to the General Partner of approximately $44,000. |
|
|
|
• |
In 2015, we realized approximately $4.8 million of contingent interest and 25% of Tier 2 income due to the General Partner of approximately $1.2 million. In addition, we reported the sale of Glynn Place and The Colonial which resulted in an approximately $1.2 million and $3.4 million gain, respectively, and 25% of Tier 2 income due to the General Partner was approximately $297,000 and $854,000, respectively. There was approximately $7.0 million that was allocated to the Unitholders. |
|
|
|
• |
In 2014,we recognized Tier 2 income of approximately $873,000 of which approximately $218,000 was allocated to the Unitholders. |
|
|
|
1) |
Management utilizes a calculation of Cash Available for Distribution (“CAD”) as a means to determine the Partnership’s ability to make distributions to Unitholders. This is a non-GAAP financial measure, Page 14 of this Supplement provides a reconciliation of GAAP Partnership net income to CAD. |
|
|
|
8 |
|

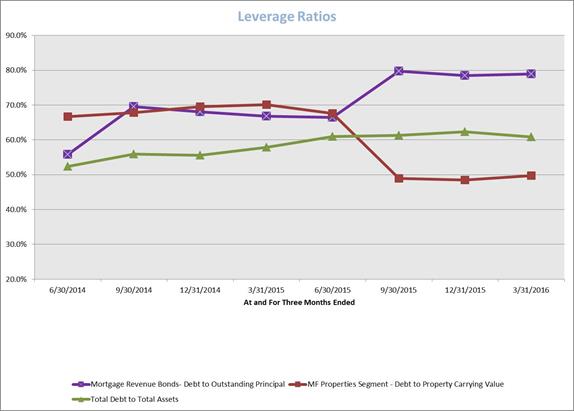
Our operating policy on leverage is:•
To maintain leverage of between 75% and 85%of the mortgage revenue bonds’ par value due to longer term TOB and TEBS facilities and credit enhancement.•
For investment grade rated assets, which are the PHC certificates and the MBS Securities, the policy allows for more consistent leverage percentages since those asset classes are rated. Our policy is to have leverage on average at 80% of the par value for these investment classes.
Our policy regarding mortgages on MF Properties is to look at a supportable loan given standard parameters of LTV and DSC. Mortgages are utilized as interim leverage while in consideration of longer term debt financing cognizant to bring the leverage ratio on total assets to a target level of 65%.
|
Weighted Average Cost of Debt |
Period End |
Period End |
|
|
Rate |
Rate |
|
|
31-Mar-16 |
31-Dec-15 |
|
TEBS Financing |
1.94% |
1.51% |
|
TOB Secured Financing |
3.42% |
3.26% |
|
Mortgages payable and other secured financing |
3.69% |
3.57% |
|
|
1) |
Amounts shown are at par and cost. |
|
|
|
9 |
|
OTHER PARTNERSHIP INFORMATION
|
Corporate Office: |
|
|
|
1004 Farnam Street |
|
|
|
Suite 400 |
|
|
|
Omaha, NE 68102 |
|
|
|
Phone: |
|
402-444-1630 |
|
Investor Services |
|
402-930-3098 |
|
Fax: |
|
402-930-3047 |
|
Web Site: |
|
www.ataxfund.com |
|
Ticker Symbol: |
|
ATAX |
|
|
|
Transfer Agent: American Stock Transfer & Trust Company |
|
|
|
59 Maiden Lane |
|
|
|
Plaza Level |
|
|
|
New York, NY 10038 |
|
Phone: |
|
718-921-8124 |
|
|
|
888-991-9902 |
|
Fax: |
|
718-236-2641 |
|
Corporate Counsel: |
|
Independent Accountants: |
|
Barnes & Thornburg LLP |
|
PwC |
|
11 S. Meridian Street |
|
1 North Wacker |
|
Indianapolis, IN 46204 |
|
Chicago, Illinois 60606 |
The Burlington Capital Group LLC, General Partner of the General Partner for
America First Multifamily Investors, L.P. - Board of Managers
|
Michael B. Yanney |
|
Chairman Emeritus of the Board |
|
Lisa Y. Roskens |
|
Chairman of the Board |
|
Mariann Byerwalter |
|
Manager Dr. William |
|
S. Carter |
|
Manager Patrick J. Jung |
|
Manager George Krauss |
|
Manager Dr. |
|
Martin Massengale |
|
Manager Dr. Gail Yanney |
|
Manager Ambassador Clayton Yeutter |
|
Manager |
|
Walter K. Griffith |
|
Manager Senator |
|
Michael Johanns |
|
Manager |
Corporate Officers
Chief Executive Officer – Chad Daffer
Chief Financial Officer – Craig S. Allen
|
|
10 |
|

|
|
|
Partnership Financial |
AMERICA FIRST MULTIFAMILY INVESTORS, L.P. BALANCE SHEETS
|
|
|
March 31, 2016 |
|
|
December 31, 2015 |
|
||
|
Assets |
|
|
|
|
|
|
|
|
|
Cash and cash equivalents |
|
$ |
17,822,453 |
|
|
$ |
17,035,782 |
|
|
Restricted cash |
|
|
8,753,563 |
|
|
|
8,950,374 |
|
|
Interest receivable |
|
|
6,014,520 |
|
|
|
5,220,859 |
|
|
Mortgage revenue bonds, held in trust |
|
|
535,399,114 |
|
|
|
536,316,481 |
|
|
Mortgage revenue bonds |
|
|
60,977,254 |
|
|
|
47,366,656 |
|
|
Public housing capital fund trusts |
|
|
60,505,340 |
|
|
|
60,707,290 |
|
|
Mortgage-backed Securities |
|
|
- |
|
|
|
14,775,309 |
|
|
Real estate assets: |
|
|
|
|
|
|
|
|
|
Land and improvements |
|
|
17,983,300 |
|
|
|
17,887,505 |
|
|
Buildings and improvements |
|
|
139,232,348 |
|
|
|
139,153,699 |
|
|
Real estate assets before accumulated depreciation |
|
|
157,215,648 |
|
|
|
157,041,204 |
|
|
Accumulated depreciation |
|
|
(17,670,045 |
) |
|
|
(16,023,814 |
) |
|
Net real estate assets |
|
|
139,545,603 |
|
|
|
141,017,390 |
|
|
Investment in equity interest |
|
|
2,414,050 |
|
|
|
- |
|
|
Other assets |
|
|
43,020,941 |
|
|
|
35,720,342 |
|
|
Total Assets |
|
$ |
874,452,838 |
|
|
$ |
867,110,483 |
|
|
|
|
|
|
|
|
|
|
|
|
Liabilities |
|
|
|
|
|
|
|
|
|
Accounts payable, accrued expenses and other liabilities |
|
$ |
5,555,618 |
|
|
$ |
5,667,948 |
|
|
Distribution payable |
|
|
7,607,693 |
|
|
|
8,759,343 |
|
|
Unsecured lines of credit |
|
|
27,984,639 |
|
|
|
17,497,000 |
|
|
Debt financing |
|
|
430,307,423 |
|
|
|
451,496,716 |
|
|
Mortgages payable and other secured financing |
|
|
69,053,487 |
|
|
|
69,247,574 |
|
|
Derivative swap, at fair value |
|
|
2,227,074 |
|
|
|
1,317,075 |
|
|
Total Liabilities |
|
|
542,735,934 |
|
|
|
553,985,656 |
|
|
Redeemable preferred units |
|
|
9,980,965 |
|
|
|
- |
|
|
Partners' Capital |
|
|
|
|
|
|
|
|
|
General Partner |
|
|
485,188 |
|
|
|
399,077 |
|
|
Beneficial Unit Certificate holders |
|
|
321,245,277 |
|
|
|
312,720,264 |
|
|
Total Partners' Capital |
|
|
321,730,465 |
|
|
|
313,119,341 |
|
|
Noncontrolling interest |
|
|
5,474 |
|
|
|
5,486 |
|
|
Total Capital |
|
|
321,735,939 |
|
|
|
313,124,827 |
|
|
Total Liabilities and Partners' Capital |
|
$ |
874,452,838 |
|
|
$ |
867,110,483 |
|
|
|
12 |
|
AMERICA FIRST MULTIFAMILY INVESTORS, L.P.
PARTNERSHIP INCOME STATEMENTS
|
|
For The Three Months Ended March 31, 2016 |
|
|
For The Three Months Ended March 31, 2015 |
|
|||
|
Revenues: |
|
|
|
|
|
|
|
|
|
Investment income |
|
$ |
9,157,234 |
|
|
$ |
7,979,784 |
|
|
Property revenues |
|
|
5,074,104 |
|
|
|
4,302,301 |
|
|
Contingent interest income |
|
|
174,396 |
|
|
|
- |
|
|
Other interest income |
|
|
514,125 |
|
|
|
224,540 |
|
|
Gain on sale of securities |
|
|
8,097 |
|
|
|
- |
|
|
Total Revenues |
|
|
14,927,956 |
|
|
|
12,506,625 |
|
|
Expenses: |
|
|
|
|
|
|
|
|
|
Real estate operating (exclusive of items shown below) |
|
|
2,636,677 |
|
|
|
2,471,030 |
|
|
Depreciation and amortization |
|
|
2,124,898 |
|
|
|
1,454,179 |
|
|
Amortization of deferred financing costs |
|
|
532,187 |
|
|
|
338,599 |
|
|
Interest |
|
|
4,770,135 |
|
|
|
3,936,176 |
|
|
General and administrative |
|
|
2,332,371 |
|
|
|
1,807,481 |
|
|
Total Expenses |
|
|
12,396,268 |
|
|
|
10,007,465 |
|
|
Income from continuing operations |
|
|
2,531,688 |
|
|
|
2,499,160 |
|
|
Income from discontinued operations |
|
|
- |
|
|
|
24,428 |
|
|
Net income before noncontrolling interest |
|
|
2,531,688 |
|
|
|
2,523,588 |
|
|
Loss attributable to noncontrolling interest |
|
|
(12 |
) |
|
|
(891 |
) |
|
Net income - ATAX Partnership |
|
$ |
2,531,700 |
|
|
$ |
2,524,479 |
|
|
|
|
|
|
|
|
|
|
|
|
Net Income |
|
|
2,531,688 |
|
|
|
2,523,588 |
|
|
Redeemable preferred unit distribution and accretion |
|
|
(1,684 |
) |
|
|
- |
|
|
Net income available to Partners and noncontrolling interest |
|
$ |
2,530,004 |
|
|
$ |
2,523,588 |
|
|
|
|
|
|
|
|
|
|
|
|
Selected Segment Data (Partnership): |
|
|
|
|
|
|
|
|
|
Revenue: |
|
|
|
|
|
|
|
|
|
Mortgage Revenue Bond Investments |
|
$ |
9,074,195 |
|
|
$ |
7,318,561 |
|
|
MF Properties |
|
|
5,074,104 |
|
|
|
4,302,301 |
|
|
Public Housing Capital Fund Trusts |
|
|
730,902 |
|
|
|
732,903 |
|
|
MBS Securities Investments |
|
|
48,755 |
|
|
|
152,860 |
|
|
Total |
|
$ |
14,927,956 |
|
|
$ |
12,506,625 |
|
|
Total Expenses: |
|
|
|
|
|
|
|
|
|
Mortgage Revenue Bond Investments |
|
$ |
6,756,858 |
|
|
$ |
4,969,039 |
|
|
MF Properties |
|
|
5,341,907 |
|
|
|
4,695,942 |
|
|
Public Housing Capital Fund Trusts |
|
|
300,720 |
|
|
|
303,755 |
|
|
MBS Securities Investments |
|
|
(3,229 |
) |
|
|
37,838 |
|
|
Total |
|
$ |
12,396,256 |
|
|
$ |
10,006,574 |
|
|
Net Income (loss) from continuing operations: |
|
|
|
|
|
|
|
|
|
Mortgage Revenue Bond Investments |
|
$ |
2,317,337 |
|
|
$ |
2,349,522 |
|
|
MF Properties |
|
|
(267,803 |
) |
|
|
(393,641 |
) |
|
Public Housing Capital Fund Trusts |
|
|
430,182 |
|
|
|
429,148 |
|
|
MBS Securities Investments |
|
|
51,984 |
|
|
|
115,022 |
|
|
Income from continuing operations |
|
$ |
2,531,700 |
|
|
$ |
2,500,051 |
|
|
|
13 |
|
AMERICA FIRST MULTIFAMILY INVESTORS, L.P.
PARTNERSHIP CASH AVAILABLE FOR DISTRIBUTION AND OTHER PERFORMANCE MEASURES
FOR THE THREE MONTHS ENDED
The following table shows the calculation of CAD (and a reconciliation of the Partnership’s net income as determined in accordance with GAAP to its CAD):
|
|
|
June 30, 2014 |
|
September 30, 2014 |
|
December 31, 2014 |
|
March 31, 2015 |
|
June 30, 2015 |
|
September 30, 2015 |
|
December 31, 2015 |
|
March 31, 2016 |
|
||||||||
|
Partnership net income |
|
$ |
3,800,139 |
|
$ |
3,473,061 |
|
$ |
2,236,621 |
|
$ |
2,670,645 |
|
$ |
8,153,317 |
|
$ |
2,514,338 |
|
$ |
9,549,326 |
|
$ |
2,531,700 |
|
|
Change in fair value of derivatives and interest rate derivative amortization |
|
|
434,071 |
|
|
153,810 |
|
|
1,239,632 |
|
|
899,873 |
|
|
(198,743 |
) |
|
1,254,564 |
|
|
(153,039 |
) |
|
1,110,407 |
|
|
Depreciation and amortization expense (Partnership only) |
|
|
1,293,553 |
|
|
1,595,360 |
|
|
1,818,169 |
|
|
1,794,814 |
|
|
1,743,317 |
|
|
1,829,026 |
|
|
2,760,643 |
|
|
2,124,898 |
|
|
Amortization of deferred financing costs |
|
|
- |
|
|
- |
|
|
- |
|
|
- |
|
|
- |
|
|
- |
|
|
- |
|
|
532,187 |
|
|
Redeemable preferred unit distribution and accretion |
|
|
- |
|
|
- |
|
|
- |
|
|
- |
|
|
- |
|
|
- |
|
|
- |
|
|
(1,684 |
) |
|
Bond purchase discount accretion (net of cash received) |
|
|
(2,393 |
) |
|
1,902 |
|
|
140,296 |
|
|
18,899 |
|
|
729,672 |
|
|
380,644 |
|
|
171,717 |
|
|
34,696 |
|
|
Developer income |
|
|
44,000 |
|
|
487,948 |
|
|
- |
|
|
- |
|
|
18,159 |
|
|
- |
|
|
- |
|
|
- |
|
|
Tier 2 Income distributable to the General Partner |
|
|
(218,295 |
) |
|
- |
|
|
(10,000 |
) |
|
- |
|
|
(854,365 |
) |
|
(296,952 |
) |
|
(1,187,639 |
) |
|
(43,599 |
) |
|
Provision for loss on receivable |
|
|
- |
|
|
- |
|
|
- |
|
|
- |
|
|
98,431 |
|
|
(98,431 |
) |
|
- |
|
|
- |
|
|
Amortization related to discontinued operations |
|
|
- |
|
|
- |
|
|
- |
|
|
- |
|
|
2,029 |
|
|
2,023 |
|
|
3,380 |
|
|
- |
|
|
CAD |
|
$ |
5,351,075 |
|
$ |
5,787,081 |
|
$ |
5,424,718 |
|
$ |
5,384,231 |
|
$ |
9,691,817 |
|
$ |
5,585,212 |
|
$ |
11,144,388 |
|
$ |
6,288,605 |
|
|
Weighted average number of units outstanding, |
|
|
|
|
|
|
|
|
|
|
|
|
|
|
|
|
|
|
|
|
|
|
|
|
|
|
basic and diluted |
|
|
60,252,928 |
|
|
60,252,928 |
|
|
60,252,928 |
|
|
60,252,928 |
|
|
60,252,928 |
|
|
60,252,928 |
|
|
60,252,928 |
|
|
60,252,928 |
|
|
|
|
|
|
|
|
|
|
|
|
|
|
|
|
|
|
|
|
|
|
|
|
|
|
|
|
|
Partnership: |
|
|
|
|
|
|
|
|
|
|
|
|
|
|
|
|
|
|
|
|
|
|
|
|
|
|
Net income, basic and diluted, per unit |
|
$ |
0.05 |
|
$ |
0.06 |
|
$ |
0.04 |
|
$ |
0.04 |
|
$ |
0.12 |
|
$ |
0.04 |
|
$ |
0.14 |
|
$ |
0.04 |
|
|
CAD per unit |
|
$ |
0.09 |
|
$ |
0.10 |
|
$ |
0.09 |
|
$ |
0.09 |
|
$ |
0.16 |
|
$ |
0.09 |
|
$ |
0.19 |
|
$ |
0.10 |
|
|
|
|
|
|
|
|
|
|
|
|
|
|
|
|
|
|
|
|
|
|
|
|
|
|
|
|
|
Distributions declared, per unit |
|
$ |
0.125 |
|
$ |
0.125 |
|
$ |
0.125 |
|
$ |
0.125 |
|
$ |
0.125 |
|
$ |
0.125 |
|
$ |
0.125 |
|
$ |
0.125 |
|
For the tax year ended December 31, 2015, taxable income was approximately 6% of the total of taxable and tax-exempt interest income on the Partnership’s tax return. In addition, income subject to AMT was approximately 11% of the tax-exempt income. A Unitholder of ATAX who had ownership for the full year would have seen a similar break out of their income on their 2015 tax form K-1.
|
|
14 |
|
AMERICA FIRST MULTIFAMILY INVESTORS, L.P.
MORTGAGE REVENUE BOND INVESTMENT SCHEDULE ON MARCH 31, 2016
|
|
|
|
|
|
|
Base |
|
|
|
|
|
|
|
|
|
|
|
|
|
|
|
Maturity |
|
Interest |
|
|
Principal |
|
|
Estimated |
|
|||
|
Property Name |
|
Location |
|
Date |
|
Rate |
|
|
Outstanding |
|
|
Fair Value |
|
|||
|
Arbors at Hickory Ridge |
|
Memphis, TN |
|
12/1/2049 |
|
|
6.25 |
% |
|
$ |
11,432,475 |
|
|
$ |
13,547,618 |
|
|
Ashley Square |
|
Des Moines, IA |
|
12/1/2025 |
|
|
6.25 |
% |
|
|
5,084,000 |
|
|
|
5,600,695 |
|
|
Avistar on the Boulevard - Series A |
|
San Antonio, TX |
|
3/1/2050 |
|
|
6.00 |
% |
|
|
16,381,921 |
|
|
|
18,582,999 |
|
|
Avistar at Chase Hill - Series A |
|
San Antonio, TX |
|
3/1/2050 |
|
|
6.00 |
% |
|
|
9,913,418 |
|
|
|
11,038,516 |
|
|
Avistar at the Crest - Series A |
|
San Antonio, TX |
|
3/1/2050 |
|
|
6.00 |
% |
|
|
9,616,015 |
|
|
|
11,114,561 |
|
|
Avistar (February 2013 Acquisition) - Series B (3 Bonds) |
|
San Antonio, TX |
|
4/1/2050 |
|
|
9.00 |
% |
|
|
2,165,824 |
|
|
|
2,422,367 |
|
|
Avistar at the Oaks - Series A |
|
San Antonio, TX |
|
8/1/2050 |
|
|
6.00 |
% |
|
|
7,761,097 |
|
|
|
8,757,361 |
|
|
Avistar in 09 - Series A |
|
San Antonio, TX |
|
8/1/2050 |
|
|
6.00 |
% |
|
|
6,701,407 |
|
|
|
7,561,642 |
|
|
Avistar on the Hills - Series A |
|
San Antonio, TX |
|
8/1/2050 |
|
|
6.00 |
% |
|
|
5,362,122 |
|
|
|
6,088,433 |
|
|
Avistar (June 2013 Acquisition) - Series B (3 Bonds) |
|
San Antonio, TX |
|
9/1/2050 |
|
|
9.00 |
% |
|
|
1,008,559 |
|
|
|
1,141,489 |
|
|
Avistar at the Parkway - Series A |
|
San Antonio, TX |
|
5/1/2052 |
|
|
6.00 |
% |
|
|
13,300,000 |
|
|
|
13,883,196 |
|
|
Avistar at the Parkway - Series B |
|
San Antonio, TX |
|
6/1/2052 |
|
|
12.00 |
% |
|
|
125,000 |
|
|
|
125,494 |
|
|
Bella Vista |
|
Gainesville, TX |
|
4/1/2046 |
|
|
6.15 |
% |
|
|
6,430,000 |
|
|
|
7,352,898 |
|
|
Bridle Ridge |
|
Greer, SC |
|
1/1/2043 |
|
|
6.00 |
% |
|
|
7,565,000 |
|
|
|
8,552,233 |
|
|
Brookstone |
|
Waukegan, IL |
|
5/1/2040 |
|
|
5.45 |
% |
|
|
9,146,168 |
|
|
|
9,037,001 |
|
|
Bruton Apartments |
|
Dallas, TX |
|
8/1/2054 |
|
|
6.00 |
% |
|
|
18,145,000 |
|
|
|
20,454,301 |
|
|
Columbia Gardens |
|
Columbia, SC |
|
12/1/2050 |
|
|
5.50 |
% |
|
|
15,000,000 |
|
|
|
14,915,592 |
|
|
Companion at Thornhill Apartments |
|
Lexington, SC |
|
1/1/2052 |
|
|
5.80 |
% |
|
|
11,500,000 |
|
|
|
12,904,405 |
|
|
Concord at Gulfgate - Series A |
|
Houston, TX |
|
2/1/2032 |
|
|
6.00 |
% |
|
|
17,060,000 |
|
|
|
18,435,668 |
|
|
Concord at Gulfgate - Series B |
|
Houston, TX |
|
3/1/2032 |
|
|
12.00 |
% |
|
|
2,125,000 |
|
|
|
2,249,242 |
|
|
Concord at Little York - Series A |
|
Houston, TX |
|
2/1/2032 |
|
|
6.00 |
% |
|
|
12,480,000 |
|
|
|
13,354,828 |
|
|
Concord at Little York - Series B |
|
Houston, TX |
|
3/1/2032 |
|
|
12.00 |
% |
|
|
960,000 |
|
|
|
963,364 |
|
|
Concord at Williamcrest - Series A |
|
Houston, TX |
|
2/1/2032 |
|
|
6.00 |
% |
|
|
18,020,000 |
|
|
|
19,473,104 |
|
|
Concord at Williamcrest - Series B |
|
Houston, TX |
|
3/1/2032 |
|
|
12.00 |
% |
|
|
2,800,000 |
|
|
|
2,880,041 |
|
|
Copper Gate Apartments |
|
Lafayette, IN |
|
12/1/2029 |
|
|
6.25 |
% |
|
|
5,185,000 |
|
|
|
5,875,953 |
|
|
Cross Creek |
|
Beaufort, SC |
|
3/1/2049 |
|
|
6.15 |
% |
|
|
8,322,627 |
|
|
|
9,274,873 |
|
|
Crossing at 1415 - Series A |
|
San Antonio, TX |
|
12/1/2052 |
|
|
6.00 |
% |
|
|
7,590,000 |
|
|
|
7,927,260 |
|
|
Crossing at 1415 - Series B |
|
San Antonio, TX |
|
1/1/2053 |
|
|
12.00 |
% |
|
|
335,000 |
|
|
|
343,116 |
|
|
Decatur Angle |
|
Fort Worth, TX |
|
1/1/2054 |
|
|
5.75 |
% |
|
|
23,000,000 |
|
|
|
25,080,032 |
|
|
Glenview - Series A |
|
Cameron Park, CA |
|
12/1/2031 |
|
|
5.75 |
% |
|
|
4,670,000 |
|
|
|
4,784,116 |
|
|
Glenview - Series B |
|
Cameron Park, CA |
|
12/1/2016 |
|
|
8.00 |
% |
|
|
2,053,000 |
|
|
|
2,044,891 |
|
|
Greens of Pine Glen - Series A |
|
North Carolina |
|
10/1/2047 |
|
|
6.50 |
% |
|
|
8,273,000 |
|
|
|
9,680,067 |
|
|
Greens of Pine Glen - Series B |
|
North Carolina |
|
10/1/2047 |
|
|
9.00 |
% |
|
|
942,560 |
|
|
|
1,107,881 |
|
|
Harden Ranch - Series A |
|
Salinas, CA |
|
3/1/2030 |
|
|
5.75 |
% |
|
|
6,960,000 |
|
|
|
7,725,305 |
|
|
Heights at 515 - Series A |
|
San Antonio, TX |
|
12/1/2052 |
|
|
6.00 |
% |
|
|
6,435,000 |
|
|
|
6,720,937 |
|
|
Heights at 515 - Series B |
|
San Antonio, TX |
|
1/1/2053 |
|
|
12.00 |
% |
|
|
510,000 |
|
|
|
522,355 |
|
|
Heritage Square - Series A |
|
Edinburg, TX |
|
9/1/2051 |
|
|
6.00 |
% |
|
|
11,185,000 |
|
|
|
12,575,428 |
|
|
Heritage Square - Series B |
|
Edinburg, TX |
|
10/1/2051 |
|
|
12.00 |
% |
|
|
520,000 |
|
|
|
559,156 |
|
|
Lake Forest Apartments |
|
Daytona Beach, FL |
|
12/1/2031 |
|
|
6.25 |
% |
|
|
8,736,000 |
|
|
|
10,034,086 |
|
|
Live 929 |
|
Baltimore, MD |
|
7/1/2049 |
|
|
5.78 |
% |
|
|
40,150,000 |
|
|
|
47,564,662 |
|
|
Montclair - Series A |
|
Lemoore, CA |
|
12/1/2031 |
|
|
5.75 |
% |
|
|
2,530,000 |
|
|
|
2,655,674 |
|
|
Montclair - Series B |
|
Lemoore, CA |
|
12/1/2016 |
|
|
8.00 |
% |
|
|
928,000 |
|
|
|
926,422 |
|
|
Ohio Bond - Series A |
|
Ohio |
|
6/1/2050 |
|
|
7.00 |
% |
|
|
14,287,000 |
|
|
|
17,484,018 |
|
|
Ohio Bond - Series B |
|
Ohio |
|
6/1/2050 |
|
|
10.00 |
% |
|
|
3,559,200 |
|
|
|
4,173,670 |
|
|
Pro Nova - 2014A |
|
Knoxville, TN |
|
5/1/2034 |
|
|
6.00 |
% |
|
|
10,000,000 |
|
|
|
10,929,900 |
|
|
Renaissance - Series A |
|
Baton Rouge, LA |
|
6/1/2050 |
|
|
6.00 |
% |
|
|
11,425,883 |
|
|
|
12,887,896 |
|
|
Runnymede |
|
Austin, TX |
|
10/1/2042 |
|
|
6.00 |
% |
|
|
10,350,000 |
|
|
|
12,201,305 |
|
|
Santa Fe - Series A |
|
Hesperia, CA |
|
12/1/2031 |
|
|
5.75 |
% |
|
|
3,065,000 |
|
|
|
3,264,878 |
|
|
Santa Fe - Series B |
|
Hesperia, CA |
|
12/1/2016 |
|
|
8.00 |
% |
|
|
1,671,000 |
|
|
|
1,668,159 |
|
|
Seasons at Simi Valley - Series A-1 |
|
Simi Valley, CA |
|
9/1/2032 |
|
|
5.75 |
% |
|
|
4,376,000 |
|
|
|
4,792,321 |
|
|
Seasons at Simi Valley - Series A-2 |
|
Simi Valley, CA |
|
9/1/2017 |
|
|
5.50 |
% |
|
|
1,944,000 |
|
|
|
2,011,332 |
|
|
Silver Moon - Series A |
|
Albuquerque, NM |
|
8/1/2055 |
|
|
6.00 |
% |
|
|
7,971,455 |
|
|
|
9,403,827 |
|
|
Southpark |
|
Austin, TX |
|
12/1/2049 |
|
|
6.13 |
% |
|
|
13,560,000 |
|
|
|
16,157,147 |
|
|
Sycamore Walk - Series B-1 |
|
Bakersfield, CA |
|
1/1/2033 |
|
|
5.25 |
% |
|
|
3,632,000 |
|
|
|
3,786,326 |
|
|
Sycamore Walk - Series B-2 |
|
Bakersfield, CA |
|
1/1/2018 |
|
|
5.50 |
% |
|
|
1,815,000 |
|
|
|
1,707,026 |
|
|
The Palms at Premier Park |
|
Columbia, SC |
|
1/1/2050 |
|
|
6.25 |
% |
|
|
19,958,648 |
|
|
|
22,861,593 |
|
|
Tyler Park Townhomes |
|
Greenfield, CA |
|
1/1/2030 |
|
|
5.75 |
% |
|
|
6,065,947 |
|
|
|
6,636,002 |
|
|
Vantage at Judson |
|
San Antonio, TX |
|
2/1/2053 |
|
|
9.00 |
% |
|
|
26,507,380 |
|
|
|
29,673,650 |
|
|
Vantage at Harlingen |
|
San Antonio, TX |
|
9/1/2053 |
|
|
9.00 |
% |
|
|
24,575,000 |
|
|
|
26,843,925 |
|
|
Westside Village Market |
|
Shafter, CA |
|
1/1/2030 |
|
|
5.75 |
% |
|
|
3,964,084 |
|
|
|
4,220,252 |
|
|
Willow Run |
|
Columbia, SC |
|
12/1/2050 |
|
|
5.50 |
% |
|
|
15,000,000 |
|
|
|
14,916,596 |
|
|
Woodlynn Village |
|
Maplewood, MN |
|
11/1/2042 |
|
|
6.00 |
% |
|
|
4,351,000 |
|
|
|
4,917,283 |
|
|
|
|
|
|
|
|
|
|
|
|
$ |
536,486,791 |
|
|
$ |
596,376,368 |
|
OTHER INVESTMENTS ON MARCH 31, 2016
|
|
|
|
|
Weighted |
|
|
Weighted Avg. |
|
|
Principal |
|
|
Estimated |
|
||||
|
Name |
|
|
|
Average Lives |
|
|
Coupon Rate |
|
|
Outstanding |
|
|
Fair Value |
|
||||
|
Public Housing Capital Fund Trust Certificate I |
|
|
|
|
9.06 |
|
|
|
5.33 |
% |
|
$ |
24,923,137 |
|
|
$ |
27,984,446 |
|
|
Public Housing Capital Fund Trust Certificate II |
|
|
|
|
8.42 |
|
|
|
4.29 |
% |
|
|
11,465,660 |
|
|
|
11,650,257 |
|
|
Public Housing Capital Fund Trust Certificate III |
|
|
|
|
9.56 |
|
|
|
5.42 |
% |
|
|
20,898,432 |
|
|
|
20,870,637 |
|
|
|
|
|
|
|
|
|
|
|
|
|
|
$ |
57,287,229 |
|
|
$ |
60,505,340 |
|
|
|
15 |
|
AMERICA FIRST MULTIFAMILY INVESTORS, L.P.
MORTGAGE REVENUE BOND INVESTMENT SCHEDULE ON DECEMBER 31, 2015
|
|
|
|
|
|
|
Base |
|
|
|
|
|
|
|
|
|
|
|
|
|
|
|
Maturity |
|
Interest |
|
|
Principal |
|
|
Estimated |
|
|||
|
Property Name |
|
Location |
|
Date |
|
Rate |
|
|
Outstanding |
|
|
Fair Value |
|
|||
|
Arbors at Hickory Ridge |
|
Memphis, TN |
|
12/1/2049 |
|
|
6.25 |
% |
|
$ |
11,450,000 |
|
|
$ |
13,333,165 |
|
|
Ashley Square |
|
Des Moines, IA |
|
12/1/2025 |
|
|
6.25 |
% |
|
|
5,099,000 |
|
|
|
5,607,163 |
|
|
Avistar at Chase Hill - Series A |
|
San Antonio, TX |
|
3/1/2050 |
|
|
6.00 |
% |
|
|
9,935,552 |
|
|
|
11,068,576 |
|
|
Avistar at the Crest - Series A |
|
San Antonio, TX |
|
3/1/2050 |
|
|
6.00 |
% |
|
|
9,637,485 |
|
|
|
10,938,709 |
|
|
Avistar at the Oak - Series A |
|
San Antonio, TX |
|
8/1/2050 |
|
|
6.00 |
% |
|
|
7,777,936 |
|
|
|
8,618,095 |
|
|
Avistar at the Parkway - Series A |
|
San Antonio, TX |
|
5/1/2052 |
|
|
6.00 |
% |
|
|
13,300,000 |
|
|
|
13,630,251 |
|
|
Avistar in 09 - Series A |
|
San Antonio, TX |
|
8/1/2050 |
|
|
6.00 |
% |
|
|
6,715,948 |
|
|
|
7,441,393 |
|
|
Avistar on the Boulevard - Series A |
|
San Antonio, TX |
|
3/1/2050 |
|
|
6.00 |
% |
|
|
16,418,497 |
|
|
|
18,290,820 |
|
|
Avistar on the Hill - Series A |
|
San Antonio, TX |
|
8/1/2050 |
|
|
6.00 |
% |
|
|
5,373,756 |
|
|
|
6,066,852 |
|
|
Bella Vista |
|
Gainesville, TX |
|
4/1/2046 |
|
|
6.15 |
% |
|
|
6,430,000 |
|
|
|
7,196,135 |
|
|
Bridle Ridge |
|
Greer, SC |
|
1/1/2043 |
|
|
6.00 |
% |
|
|
7,595,000 |
|
|
|
8,412,222 |
|
|
Brookstone |
|
Waukegan, IL |
|
5/1/2040 |
|
|
5.45 |
% |
|
|
9,168,742 |
|
|
|
8,904,871 |
|
|
Bruton Apartments |
|
Dallas, TX |
|
8/1/2054 |
|
|
6.00 |
% |
|
|
18,145,000 |
|
|
|
20,046,839 |
|
|
Columbia Gardens |
|
Columbia, SC |
|
12/1/2050 |
|
|
5.50 |
% |
|
|
15,000,000 |
|
|
|
15,224,597 |
|
|
Concord at Gulfgate - Series A |
|
Houston, TX |
|
2/1/2032 |
|
|
6.00 |
% |
|
|
17,060,000 |
|
|
|
17,912,612 |
|
|
Concord at Little York - Series A |
|
Houston, TX |
|
2/1/2032 |
|
|
6.00 |
% |
|
|
12,480,000 |
|
|
|
13,168,441 |
|
|
Concord at Williamcrest - Series A |
|
Houston, TX |
|
2/1/2032 |
|
|
6.00 |
% |
|
|
18,020,000 |
|
|
|
19,202,543 |
|
|
Copper Gate |
|
Lafayette, IN |
|
12/1/2029 |
|
|
6.25 |
% |
|
|
5,185,000 |
|
|
|
5,801,341 |
|
|
Cross Creek Apartments |
|
Beaufort, SC |
|
3/1/2049 |
|
|
6.15 |
% |
|
|
8,343,321 |
|
|
|
9,034,294 |
|
|
Crossing at 1415 - Series A |
|
San Antonio, TX |
|
12/1/2052 |
|
|
6.00 |
% |
|
|
7,590,000 |
|
|
|
7,798,523 |
|
|
Decatur-Angle |
|
Fort Worth, TX |
|
1/1/2054 |
|
|
5.75 |
% |
|
|
23,000,000 |
|
|
|
24,582,083 |
|
|
Glenview - Series A |
|
Cameron Park, CA |
|
12/1/2031 |
|
|
5.75 |
% |
|
|
4,670,000 |
|
|
|
4,880,572 |
|
|
Greens of Pine Glen - Series A |
|
North Carolina |
|
5/1/2042 |
|
|
6.50 |
% |
|
|
8,294,000 |
|
|
|
9,432,270 |
|
|
Harden Ranch - Series A |
|
Salinas, California |
|
3/1/2030 |
|
|
5.75 |
% |
|
|
6,960,000 |
|
|
|
7,628,981 |
|
|
Heights at 515 - Series A |
|
San Antonio, TX |
|
12/1/2052 |
|
|
6.00 |
% |
|
|
6,435,000 |
|
|
|
6,611,791 |
|
|
Heritage Square - Series A |
|
Edinberg. TX |
|
9/1/2051 |
|
|
6.00 |
% |
|
|
11,185,000 |
|
|
|
11,458,488 |
|
|
Lake Forest Apartments |
|
Daytona Beach, FL |
|
12/1/2031 |
|
|
6.25 |
% |
|
|
8,766,000 |
|
|
|
9,943,745 |
|
|
Live 929 Apartments |
|
Baltimore, MD |
|
7/1/2049 |
|
|
5.78 |
% |
|
|
40,175,000 |
|
|
|
46,631,412 |
|
|
Montclair - Series A |
|
Lemoore, CA |
|
12/1/2031 |
|
|
5.75 |
% |
|
|
2,530,000 |
|
|
|
2,644,079 |
|
|
Ohio Bond - Series A |
|
Ohio |
|
6/1/2050 |
|
|
7.00 |
% |
|
|
14,311,000 |
|
|
|
17,001,867 |
|
|
Pro Nova - 2014-1 |
|
Knoxville. TN |
|
5/1/2034 |
|
|
6.00 |
% |
|
|
10,000,000 |
|
|
|
10,813,700 |
|
|
Pro Nova - 2014-2 |
|
Knoxville. TN |
|
5/1/2025 |
|
|
5.25 |
% |
|
|
9,295,000 |
|
|
|
9,748,689 |
|
|
Renaissance - Series A |
|
Baton Rouge, LA |
|
6/1/2050 |
|
|
6.00 |
% |
|
|
11,450,959 |
|
|
|
12,684,036 |
|
|
Runnymede |
|
Austin, TX |
|
10/1/2042 |
|
|
6.00 |
% |
|
|
10,350,000 |
|
|
|
11,950,938 |
|
|
Santa Fe - Series A |
|
Hesperia, CA |
|
12/1/2031 |
|
|
5.75 |
% |
|
|
3,065,000 |
|
|
|
3,219,067 |
|
|
Seasons at Simi Valley - Series A-1 |
|
Simi Valley, CA |
|
9/1/2032 |
|
|
5.75 |
% |
|
|
4,376,000 |
|
|
|
4,723,263 |
|
|
Silver Moon - Series A |
|
Albuquerque, NM |
|
8/1/2055 |
|
|
6.00 |
% |
|
|
7,983,811 |
|
|
|
9,230,160 |
|
|
Southpark |
|
Austin, TX |
|
12/1/2049 |
|
|
6.13 |
% |
|
|
13,560,000 |
|
|
|
15,790,756 |
|
|
Sycamore Walk - Series B-1 |
|
Bakersfield, CA |
|
1/1/2033 |
|
|
5.25 |
% |
|
|
3,632,000 |
|
|
|
3,632,000 |
|
|
The Palms at Premier Park |
|
Columbia, SC |
|
1/1/2050 |
|
|
6.25 |
% |
|
|
20,001,272 |
|
|
|
22,506,363 |
|
|
Tyler Park Townhomes - Series A |
|
Greenfield, CA |
|
1/1/2030 |
|
|
5.75 |
% |
|
|
6,075,000 |
|
|
|
6,562,209 |
|
|
Vantage at Harlingen |
|
San Antonio, TX |
|
9/1/2053 |
|
|
9.00 |
% |
|
|
24,575,000 |
|
|
|
26,340,139 |
|
|
Vantage at Judson |
|
San Antonio, TX |
|
2/1/2053 |
|
|
9.00 |
% |
|
|
26,540,000 |
|
|
|
29,153,606 |
|
|
Westside Village - Series A |
|
Shafter, CA |
|
1/1/2030 |
|
|
5.75 |
% |
|
|
3,970,000 |
|
|
|
4,172,340 |
|
|
Willow Run |
|
Columbia, SC |
|
12/1/2050 |
|
|
5.50 |
% |
|
|
15,000,000 |
|
|
|
15,224,591 |
|
|
Woodlynn Village |
|
Maplewood, MN |
|
11/1/2042 |
|
|
6.00 |
% |
|
|
4,351,000 |
|
|
|
4,817,471 |
|
|
Other Series B Bonds |
|
Multiple |
|
Multiple |
|
Multiple |
|
|
|
23,469,221 |
|
|
|
24,601,079 |
|
|
|
Total Mortgage Revenue Bonds |
|
|
|
|
|
|
|
|
|
$ |
534,745,500 |
|
|
$ |
583,683,137 |
|
OTHER INVESTMENTS ON DECEMBER 31, 2015
|
|
|
|
|
Weighted |
|
|
Weighted Avg. |
|
|
Principal |
|
|
Estimated |
|
||||
|
Name |
|
|
|
Average Lives |
|
|
Coupon Rate |
|
|
Outstanding |
|
|
Fair Value |
|
||||
|
Public Housing Capital Fund Trust Certificate I |
|
|
|
|
9.25 |
|
|
|
5.33 |
% |
|
$ |
25,980,780 |
|
|
$ |
28,756,827 |
|
|
Public Housing Capital Fund Trust Certificate II |
|
|
|
|
8.67 |
|
|
|
4.29 |
% |
|
|
11,465,660 |
|
|
|
11,447,430 |
|
|
Public Housing Capital Fund Trust Certificate III |
|
|
|
|
9.81 |
|
|
|
5.42 |
% |
|
|
20,898,432 |
|
|
|
20,503,033 |
|
|
|
|
|
|
|
|
|
|
|
|
|
|
$ |
58,344,872 |
|
|
$ |
60,707,290 |
|
|
|
|
|
|
Weighted Avg. |
|
|
Weighted Avg. |
|
|
|
|
|
|
|
|
|
||
|
Mortgage-backed Securities (Agency Rating) |
|
|
|
Maturity Date |
|
|
Coupon Rate |
|
|
|
|
|
|
|
|
|
||
|
"AAA" |
|
|
|
7/1/2032 |
|
|
|
4.60 |
% |
|
$ |
5,000,000 |
|
|
$ |
5,017,700 |
|
|
|
"AA" |
|
|
|
7/9/2036 |
|
|
|
4.20 |
% |
|
|
9,765,000 |
|
|
|
9,757,609 |
|
|
|
|
|
|
|
|
|
|
|
|
|
|
|
$ |
14,765,000 |
|
|
$ |
14,775,309 |
|
|
|
16 |
|
AMERICA FIRST MULTIFAMILY INVESTORS, L.P.
MORTGAGE BOND PROPERTIES PHYSICAL OCCUPANCY
|
|
Total |
|
Percentage of Occupied Units by Quarter |
|
|
|
|
||||||||||||||||||||
|
|
Number |
|
June 30, |
|
September 30, |
|
December 31, |
|
March 31, |
|
June 30, |
|
September 30, |
|
December 31, |
|
March 31, |
|
|||||||||
|
Property Name |
of Units |
|
2014 |
|
2014 |
|
2014 |
|
2015 |
|
2015 |
|
2015 |
|
2015 |
|
2016 |
|
|||||||||
|
|
|
|
|
|
|
|
|
|
|
|
|
|
|
|
|
|
|
|
|
|
|
|
|
|
|
|
|
|
Mortgage Bond Properties |
|
|
|
|
|
|
|
|
|
|
|
|
|
|
|
|
|
|
|
|
|
|
|
|
|
|
|
|
Arbors at Hickory Ridge |
348 |
|
|
91 |
% |
|
93 |
% |
|
93 |
% |
|
96 |
% |
|
93 |
% |
|
88 |
% |
|
87 |
% |
|
90 |
% |
|
|
Ashley Square Apartments |
144 |
|
|
90 |
% |
|
94 |
% |
|
94 |
% |
|
92 |
% |
|
98 |
% |
|
94 |
% |
|
95 |
% |
|
95 |
% |
|
|
Avistar at Chase Hill 1 |
232 |
|
n/a |
|
|
92 |
% |
|
90 |
% |
|
94 |
% |
|
97 |
% |
|
91 |
% |
|
89 |
% |
|
88 |
% |
||
|
Avistar at the Crest 1 |
200 |
|
n/a |
|
|
98 |
% |
|
92 |
% |
|
97 |
% |
|
98 |
% |
|
98 |
% |
|
96 |
% |
|
97 |
% |
||
|
Avistar at the Oaks 1 |
156 |
|
n/a |
|
|
87 |
% |
|
91 |
% |
|
94 |
% |
|
96 |
% |
|
93 |
% |
|
91 |
% |
|
96 |
% |
||
|
Avistar at the Parkway 4 |
236 |
|
n/a |
|
n/a |
|
n/a |
|
n/a |
|
|
76 |
% |
|
63 |
% |
|
47 |
% |
|
44 |
% |
|||||
|
Avistar in 09 1 |
133 |
|
n/a |
|
|
96 |
% |
|
96 |
% |
|
96 |
% |
|
95 |
% |
|
95 |
% |
|
95 |
% |
|
95 |
% |
||
|
Avistar on the Boulevard 1 |
344 |
|
n/a |
|
|
97 |
% |
|
95 |
% |
|
92 |
% |
|
92 |
% |
|
95 |
% |
|
92 |
% |
|
92 |
% |
||
|
Avistar on the Hills 1 |
129 |
|
n/a |
|
|
95 |
% |
|
95 |
% |
|
96 |
% |
|
98 |
% |
|
95 |
% |
|
95 |
% |
|
97 |
% |
||
|
Bella Vista Apartments |
144 |
|
|
97 |
% |
|
96 |
% |
|
98 |
% |
|
99 |
% |
|
97 |
% |
|
95 |
% |
|
96 |
% |
|
94 |
% |
|
|
Bridle Ridge Apartments |
152 |
|
|
98 |
% |
|
98 |
% |
|
98 |
% |
|
100 |
% |
|
98 |
% |
|
97 |
% |
|
99 |
% |
|
99 |
% |
|
|
Brookstone Apartments |
168 |
|
|
99 |
% |
|
95 |
% |
|
98 |
% |
|
99 |
% |
|
99 |
% |
|
99 |
% |
|
99 |
% |
|
100 |
% |
|
|
Bruton Apartments 4 |
n/a |
|
n/a |
|
n/a |
|
n/a |
|
n/a |
|
n/a |
|
n/a |
|
n/a |
|
|
14 |
% |
||||||||
|
Columbia Gardens 3 |
188 |
|
n/a |
|
n/a |
|
n/a |
|
n/a |
|
n/a |
|
n/a |
|
|
86 |
% |
|
83 |
% |
|||||||
|
Concord at Gulfgate 3 |
288 |
|
n/a |
|
n/a |
|
n/a |
|
|
89 |
% |
|
83 |
% |
|
78 |
% |
|
75 |
% |
|
84 |
% |
||||
|
Concord at Little York 3 |
276 |
|
n/a |
|
n/a |
|
n/a |
|
|
85 |
% |
|
76 |
% |
|
72 |
% |
|
67 |
% |
|
77 |
% |
||||
|
Concord at Williamcrest 3 |
288 |
|
n/a |
|
n/a |
|
n/a |
|
|
86 |
% |
|
77 |
% |
|
74 |
% |
|
73 |
% |
|
86 |
% |
||||
|
Copper Gate 1 |
128 |
|
|
99 |
% |
|
96 |
% |
|
95 |
% |
|
95 |
% |
|
93 |
% |
|
95 |
% |
|
96 |
% |
|
100 |
% |
|
|
Cross Creek Apartments |
144 |
|
|
93 |
% |
|
96 |
% |
|
94 |
% |
|
92 |
% |
|
94 |
% |
|
96 |
% |
|
94 |
% |
|
94 |
% |
|
|
Crossing at 1415 3 |
112 |
|
n/a |
|
n/a |
|
n/a |
|
n/a |
|
n/a |
|
n/a |
|
|
73 |
% |
|
51 |
% |
|||||||
|
Decatur Angle 4 |
n/a |
|
n/a |
|
n/a |
|
n/a |
|
n/a |
|
n/a |
|
n/a |
|
n/a |
|
|
57 |
% |
||||||||
|
Glenview Apartments 3 |
88 |
|
n/a |
|
n/a |
|
|
97 |
% |
|
99 |
% |
|
97 |
% |
|
98 |
% |
|
100 |
% |
|
98 |
% |
|||
|
Greens of Pine Glen |
168 |
|
|
93 |
% |
|
87 |
% |
|
93 |
% |
|
93 |
% |
|
93 |
% |
|
95 |
% |
|
96 |
% |
|
96 |
% |
|
|
Harden Ranch 3 |
100 |
|
|
98 |
% |
|
95 |
% |
|
99 |
% |
|
99 |
% |
|
99 |
% |
|
97 |
% |
|
96 |
% |
|
98 |
% |
|
|
Heights at 515 3 |
97 |
|
n/a |
|
n/a |
|
n/a |
|
n/a |
|
n/a |
|
n/a |
|
|
82 |
% |
|
65 |
% |
|||||||
|
Heritage Square 3 |
204 |
|
n/a |
|
|
85 |
% |
|
81 |
% |
|
67 |
% |
|
66 |
% |
|
73 |
% |
|
91 |
% |
|
96 |
% |
||
|
Lake Forest Apartments |
240 |
|
|
88 |
% |
|
94 |
% |
|
95 |
% |
|
96 |
% |
|
88 |
% |
|
95 |
% |
|
97 |
% |
|
88 |
% |
|
|
Live 929 Apartments 2 & 3 |
575 |
|
n/a |
|
|
96 |
% |
|
97 |
% |
|
92 |
% |
|
89 |
% |
|
91 |
% |
|
92 |
% |
|
91 |
% |
||
|
Montclair Apartments 3 |
80 |
|
n/a |
|
n/a |
|
|
96 |
% |
|
98 |
% |
|
96 |
% |
|
100 |
% |
|
96 |
% |
|
99 |
% |
|||
|
Ohio Properties |
362 |
|
|
96 |
% |
|
97 |
% |
|
96 |
% |
|
95 |
% |
|
96 |
% |
|
97 |
% |
|
96 |
% |
|
98 |
% |
|
|
Palms at Premier Park 3 |
240 |
|
|
90 |
% |
|
92 |
% |
|
95 |
% |
|
90 |
% |
|
95 |
% |
|
91 |
% |
|
93 |
% |
|
94 |
% |
|
|
Renaissance Gateway |
208 |
|
n/a |
|
|
94 |
% |
|
93 |
% |
|
100 |
% |
|
96 |
% |
|
93 |
% |
|
96 |
% |
|
96 |
% |
||
|
Runnymede Apartments |
252 |
|
|
97 |
% |
|
96 |
% |
|
97 |
% |
|
98 |
% |
|
97 |
% |
|
96 |
% |
|
98 |
% |
|
99 |
% |
|
|
Santa Fe Apartments 3 |
89 |
|
n/a |
|
n/a |
|
|
99 |
% |
|
100 |
% |
|
100 |
% |
|
97 |
% |
|
99 |
% |
|
98 |
% |
|||
|
Seasons at Simi Valley 3 |
69 |
|
n/a |
|
n/a |
|
n/a |
|
n/a |
|
n/a |
|
|
100 |
% |
|
100 |
% |
|
99 |
% |
||||||
|
Silver Moon 3 |
151 |
|
n/a |
|
n/a |
|
n/a |
|
n/a |
|
|
83 |
% |
|
97 |
% |
|
95 |
% |
|
88 |
% |
|||||
|
South Park Ranch Apartments |
192 |
|
|
99 |
% |
|
99 |
% |
|
99 |
% |
|
100 |
% |
|
99 |
% |
|
100 |
% |
|
100 |
% |
|
100 |
% |
|
|
Sycamore Walk 3 |
112 |
|
n/a |
|
n/a |
|
n/a |
|
n/a |
|
n/a |
|
n/a |
|
|
98 |
% |
|
100 |
% |
|||||||
|
Thornhill |
180 |
|
n/a |
|
n/a |
|
n/a |
|
n/a |
|
n/a |
|
n/a |
|
n/a |
|
|
98 |
% |
||||||||
|
Tyler Park Apartments 3 |
88 |
|
|
100 |
% |
|
99 |
% |
|
99 |
% |
|
98 |
% |
|
100 |
% |
|
100 |
% |
|
98 |
% |
|
99 |
% |
|
|
Vantage at Harlingen 4 |
288 |
|
n/a |
|
n/a |
|
n/a |
|
n/a |
|
|
70 |
% |
|
81 |
% |
|
82 |
% |
|
78 |
% |
|||||
|
Vantage at Judson |
288 |
|
|
61 |
% |
|
91 |
% |
|
90 |
% |
|
91 |
% |
|
92 |
% |
|
92 |
% |
|
89 |
% |
|
91 |
% |
|
|
Westside Village 3 |
81 |
|
|
100 |
% |
|
96 |
% |
|
96 |
% |
|
100 |
% |
|
100 |
% |
|
100 |
% |
|
100 |
% |
|
99 |
% |
|
|
Willow Run 3 |
200 |
|
n/a |
|
n/a |
|
n/a |
|
n/a |
|
n/a |
|
n/a |
|
|
92 |
% |
|
88 |
% |
|||||||
|
Woodlynn Village |
59 |
|
|
90 |
% |
|
86 |
% |
|
86 |
% |
|
93 |
% |
|
98 |
% |
|
98 |
% |
|
100 |
% |
|
97 |
% |
|
|
|
|
8,703 |
|
|
|
|
|
|
|
|
|
|
|
|
|
|
|
|
|
|
|
|
|
|
|
|
|
|
|
1) |
Mortgage bond secured by this property was acquired in 2013. The rehabilitation construction was completed in the third quarter of 2014. |
|
|
2) |
Student housing facility - number of units equals number of beds. Occupancy is lower in the summer months. |
|
|
3) |
Mortgage bonds were acquired in the quarter the occupancy began to be reported. |
|
|
4) |
The Property’s construction is complete and is in the stabilization stage and lease-up. |
|
|
17 |
|
AMERICA FIRST MULTIFAMILY INVESTORS, L.P.
MF PROPERTIES PHYSICAL OCCUPANCY
|
|
Total |
|
Percentage of Occupied Units |
|
|||||||||||||||||||||||
|
|
Number |
|
June 30, |
|
September 30, |
|
December 31, |
|
March 31, |
|
June 30, |
|
September 30, |
|
December 31, |
|
March 31, |
|
|||||||||
|
Property Name |
of Units |
|
2014 |
|
2014 |
|
2014 |
|
2015 |
|
2015 |
|
2015 |
|
2015 |
|
2016 |
|
|||||||||
|
MF Properties |
|
|
|
|
|
|
|
|
|
|
|
|
|
|
|
|
|
|
|
|
|
|
|
|
|
|
|
|
Arboretum |
145 |
|
|
97 |
% |
|
99 |
% |
|
99 |
% |
|
97 |
% |
|
99 |
% |
|
97 |
% |
|
98 |
% |
|
98 |
% |
|
|
Eagle Village 1 |
511 |
|
|
41 |
% |
|
69 |
% |
|
68 |
% |
|
68 |
% |
|
62 |
% |
|
97 |
% |
|
90 |
% |
|
90 |
% |
|
|
Glynn Place |
128 |
|
|
85 |
% |
|
88 |
% |
|
83 |
% |
|
94 |
% |
|
93 |
% |
n/a |
|
n/a |
|
n/a |
|
||||
|
Northernview (f/k/a Meadowview) 2 |
270 |
|
|
85 |
% |
|
98 |
% |
|
85 |
% |
|
77 |
% |
|
57 |
% |
|
91 |
% |
|
90 |
% |
|
90 |
% |
|
|
Residences at DeCordova |
110 |
|
|
95 |
% |
|
95 |
% |
|
94 |
% |
|
95 |
% |
|
96 |
% |
|
98 |
% |
|
96 |
% |
|
96 |
% |
|
|
Residences at Weatherford |
76 |
|
|
99 |
% |
|
100 |
% |
|
97 |
% |
|
100 |
% |
|
99 |
% |
|
97 |
% |
|
100 |
% |
|
100 |
% |
|
|
Suites at Paseo 1 & 3 |
394 |
|
|
36 |
% |
|
89 |
% |
|
90 |
% |
|
78 |
% |
|
62 |
% |
|
98 |
% |
|
89 |
% |
|
89 |
% |
|
|
The 50/50 MF Property 1 |
475 |
|
n/a |
|
|
99 |
% |
|
96 |
% |
|
99 |
% |
|
97 |
% |
|
100 |
% |
|
99 |
% |
|
99 |
% |
||
|
The Colonial |
258 |
|
|
85 |
% |
|
90 |
% |
|
86 |
% |
|
90 |
% |
n/a |
|
n/a |
|
n/a |
|
n/a |
|
|||||
|
Woodland Park |
236 |
|
|
92 |
% |
|
93 |
% |
|
89 |
% |
|
87 |
% |
|
92 |
% |
|
92 |
% |
|
95 |
% |
|
95 |
% |
|
|
|
|
2,603 |
|
|
|
|
|
|
|
|
|
|
|
|
|
|
|
|
|
|
|
|
|
|
|
|
|
|
|
1) |
Student housing facility - number of units equals number of beds. Occupancy is lower in the summer months. |
|
|
|
2) |
Northern View is in transition from a multifamily housing facility to a student housing facility |
|
|
|
3) |
In September 2015, the owner of the Suites on Paseo property and the Partnership mutually agreed to exchange the deed for the Suites on Paseo property, a California property, in exchange for the par value Series A and B mortgage revenue bonds plus accrued interest. |
|
|
|
18 |
|