
Exhibit 99.1

|
Supplemental Financial Report for Quarter Ended March 31, 2019 |
|
|
|
|
AMERICA FIRST MULTIFAMILY INVESTORS, L.P.
All statements in this document other than statements of historical facts, including statements regarding our future results of operations and financial position, business strategy and plans and objectives of management for future operations, are forward-looking statements. When used, statements which are not historical in nature, including those containing words such as “anticipate,” “estimate,” “should,” “expect,” “believe,” “intend,” and similar expressions, are intended to identify forward-looking statements. We have based forward-looking statements largely on our current expectations and projections about future events and financial trends that we believe may affect our business, financial condition and results of operations. This document may also contain estimates and other statistical data made by independent parties and by us relating to market size and growth and other industry data. This data involves a number of assumptions and limitations, and you are cautioned not to give undue weight to such estimates. We have not independently verified the statistical and other industry data generated by independent parties contained in this supplement and, accordingly, we cannot guarantee their accuracy or completeness. In addition, projections, assumptions and estimates of our future performance and the future performance of the industries in which we operate are necessarily subject to a high degree of uncertainty and risk due to a variety of factors, including those described under the headings “Item 1A Risk Factors” in our 2018 Annual Report on Form 10-K for the year ended December 31, 2018. These forward-looking statements are subject to various risks and uncertainties and America First Multifamily Investors, L.P. expressly disclaims any obligation to publicly update or revise any forward-looking statements, whether as a result of new information, future events or otherwise.
Most, but not all, of the selected financial information furnished herein is derived from the America First Multifamily Investors, L.P.’s (“ATAX” or “Partnership”) consolidated financial statements and related notes prepared in accordance with GAAP and management’s discussion and analysis of financial condition and results of operations included in the Partnership’s reports on Forms 10-K and 10-Q. The Partnership’s annual consolidated financial statements were subject to an independent audit, dated February 28, 2019.
Disclosure Regarding Non-GAAP Measures
This document refers to certain financial measures that are identified as non-GAAP. We believe these non-GAAP measures are helpful to investors because they are the key information used by management to analyze our operations. This supplemental information should not be considered in isolation or as a substitute for the related GAAP measures.
Please see the consolidated financial statements we filed with the Securities and Exchange Commission on Forms 10-K and 10-Q. Our GAAP consolidated financial statements can be located upon searching for the Partnership’s filings at www.sec.gov.
|
|
|
|
|
|
|
PARTNERSHIP FINANCIAL INFORMATION
TABLE OF CONTENTS
|
|
Pages |
|
|
|
Supplemental Letter from the CEO |
4 |
|
|
Quarterly Fact Sheet |
5 |
|
|
Financial Performance Trend Graphs |
6-13 |
|
|
Other Partnership Information |
14 |
|
|
Partnership Financial Statements |
15-17 |
|
|
Partnership Financial Measures and Schedules |
18-24 |
|
|
|
|
|
|
|
|
|
|
|
AMERICA FIRST MULTIFAMILY INVESTORS L.P.
SUPPLEMENTAL LETTER FROM THE CEO
During Q1 2019, ATAX continued to focus its efforts to “fine tune” the Balance Sheet. The results for Q1 2019 are as follows:
|
|
• |
Total revenue increased approximately $1.2 million, or 7.3%, to $17.7 million for the first quarter 2019; |
|
|
• |
Net income, basic and diluted, decreased by $0.01 per Beneficial Unit Certificate (“BUC”), or 11.1%, to $0.08 per BUC in the first quarter 2019; and |
|
|
• |
Cash Available for Distribution(“CAD”) increased approximately $0.01 per BUC, or 10.0%, to $0.11 per BUC in the first quarter 2019. |
The Partnership reported the following notable transactions during the first quarter of 2019:
|
|
• |
Acquired two Mortgage Revenue Bonds for approximately $6.1 million; |
|
|
• |
Additional Investment in unconsolidated entities of approximately $6.6 million; |
|
|
• |
Redemption of one Mortgage Revenue Bond for approximately $5.6 million; |
|
|
• |
Redemption of one Property Loan for approximately $8.4 million; and |
|
|
• |
Executed two new Term A/B Trusts for approximately $5.3 million. |
In January 2019, one multifamily project was sold by its managing member and ATAX’s loan investment was repaid. The details of the sale transaction are as follows:
|
|
• |
Vantage at Brooks – ATAX invested in the Vantage at Brooks multifamily, market-rate project as a loan investment in the fourth quarter 2015. The sale of the 288-unit project resulted in: |
|
|
o |
Repayment, in full, of ATAX’s loan investment principal and accrued interest, and |
|
|
o |
Recognition of approximately $3.0 million of contingent interest income in the first quarter 2019. |
The sale of Vantage at Brooks has continued to provide us with a “proof of concept” that initially attracted us to the Vantage investments. We have partnered with a developer that continues to construct high quality, multifamily projects in geographic areas of the country that have been attractive to tenants and prospective buyers.
Thank you for your continued support of ATAX!

Chad Daffer
Chief Executive Officer
|
|
4 |
|
|
|
|
|
PARTNERSHIP DETAILS |
|
ATAX was formed for the primary purpose of acquiring a portfolio of MRBs that are issued to provide construction and/or permanent financing of multifamily residential properties. We continue to expect most of the interest paid on these MRBs to be excludable from gross income for federal income tax purposes. We continue to pursue a business strategy of acquiring additional MRBs and other investments on a leveraged basis. We also invest in other securities which, if not secured by a direct or indirect interest in a multifamily property, must be rated in one of the four highest rating categories by at least one nationally recognized securities rating agency. We have also acquired interests in multifamily projects (“MF Properties”) to position ourselves for future investments in MRBs issued to finance these properties. In addition, we have invested in equity interests in multifamily, market rate projects throughout the U.S. |
||||||
|
(As of March 31, 2019) |
|
|||||||
|
Symbol (NASDAQ) |
|
|
ATAX |
|
||||
|
Annual Distribution |
|
$ |
0.50 |
|
||||
|
Price |
|
$ |
6.87 |
|
||||
|
Yield |
|
|
7.3% |
|
||||
|
|
|
|
|
|
||||
|
BUCs Outstanding (including Restricted Units) |
|
|
60,691,467 |
|
||||
|
Market Capitalization |
|
$ |
416,950,378 |
|
||||
|
52-week BUC price range |
|
|
$5.20 to $6.87 |
|
||||
|
|
|
|
|
|
||||
|
Partnership Financial Information for the Q1 2019 ($’s in 000’s, except per BUC) |
|
|||||||
|
|
|
|
|
|
||||
|
|
|
|
|
|
||||
|
Total Revenue |
|
$ |
17,665 |
|
||||
|
Net Income – ATAX Partnership |
|
$ |
6,452 |
|
||||
|
Total Assets |
|
$ |
993,198 |
|
||||
|
Leverage Ratio1 |
|
|
60% |
|
||||
|
Cash Available for Distribution (“CAD”)2 |
|
$ |
6,574 |
|
||||
|
Distribution Declared per BUC3 |
|
$ |
0.125 |
|
||||
|
1 |
Our overall leverage ratio is calculated as total outstanding debt divided by total partnership assets using the carrying value of the MRBs, PHC Certificates, property loans, taxable MRBs, initial finance costs, and the MF Properties at cost. |
|
2 |
Management utilizes a calculation of Cash Available for Distribution (“CAD”) to assess the Partnership’s operating performance. This is a non-GAAP financial measure and a reconciliation of our GAAP net income to CAD for the last eight fiscal quarters is provided on page 18 of the Supplement herein. |
|
3 |
The most recent distribution was paid on April 30, 2019 for BUC holders of record as of March 29, 2019. The distribution is payable to BUC holders of record as of the last business day of the quarter end and ATAX trades ex-dividend two days prior to the record date, with a payable date of the last business day of the subsequent month. |
|
|
5 |
|
|
|
|
At March 31, 2019
|
|
6 |
|
|
|
|
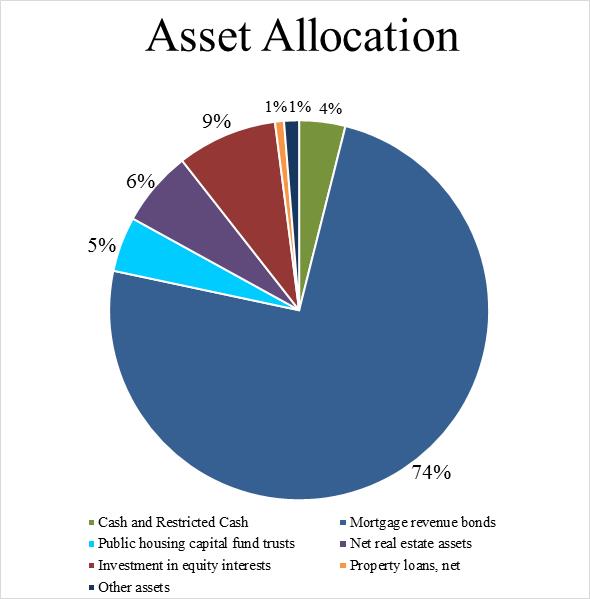
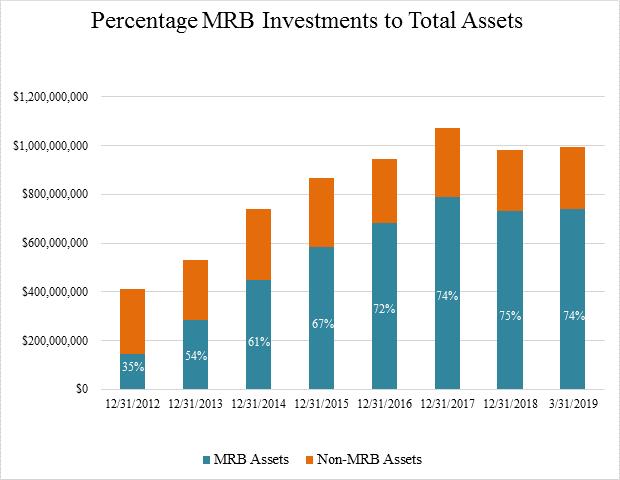
ATAX MORTGAGE REVENUE BOND PROFILE
|
|
• |
Total mortgage revenue bonds, core assets of ATAX, have increased to 74% of Total Assets at March 31, 2019, from 35% of Total Assets at December 31, 2012. |
|
|
|
7 |
|
|
|
|
At March 31, 2019
|
|
8 |
|
|
|
|
DEBT FINANCING, NET ($’s in 000’s)
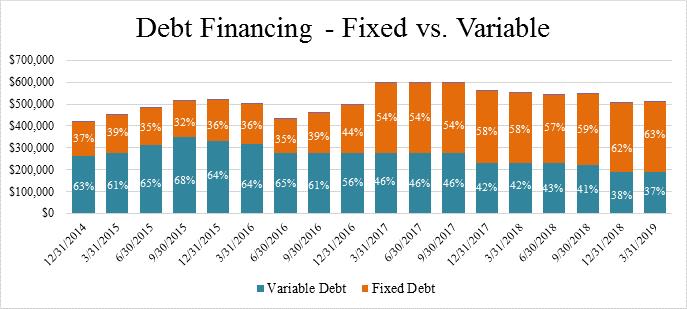
INTEREST RATE SENSITIVITY ANALYSIS1
|
Description |
|
- 25 basis points |
|
+ 50 basis points |
|
+ 100 basis points |
|
+ 150 basis points |
|
+ 200 basis points |
|
TOB & Term A/B Debt Financings |
|
$48,081 |
|
$(94,959) |
|
$(189,988) |
|
$(285,099) |
|
$(380,178) |
|
TEBS Debt Financings |
|
156,271 |
|
(145,351) |
|
(286,397) |
|
(427,743) |
|
(569,093) |
|
Other Investment Financings |
|
67,619 |
|
(135,165) |
|
(270,234) |
|
(405,206) |
|
(540,082) |
|
Total |
|
$271,971 |
|
$(375,475) |
|
$(746,619) |
|
$(1,118,048) |
|
$(1,489,353) |
|
|
1 |
Represents the change over the next 12 months assuming an immediate shift in rates and management does not adjust its strategy in response. |
|
|
9 |
|
|
|
|
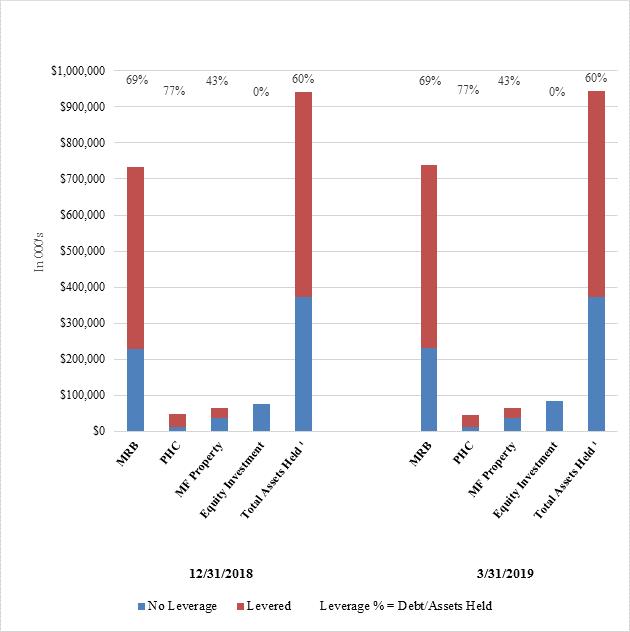
ATAX ASSETS HELD - $’s AND LEVERAGE %’s
|
|
1 |
Total outstanding debt divided by total assets using the carrying value of the MRBs, PHC Certificates, property loans, taxable MRBs, initial finance costs and the MF Properties at cost. |
|
|
|
10 |
|
|
|
|
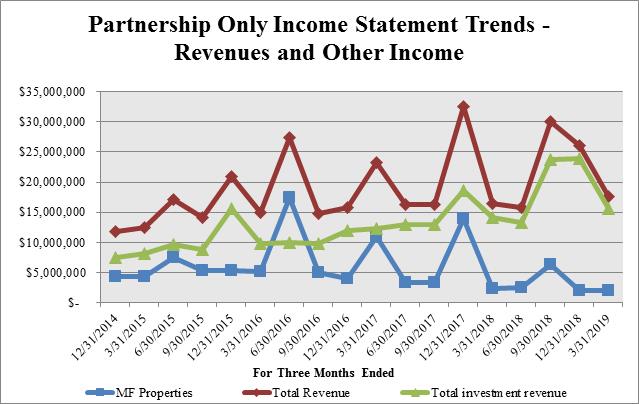
REVENUE AND OTHER INCOME TRENDS
Highlighted transactions recorded during the past eight quarters include the following:
|
|
• |
During the first quarter of 2019, we recognized contingent interest of approximately $3.0 million. Tier 2 income paid to the General Partner for this item was approximately $753,000. |
|
|
• |
During the fourth quarter of 2018, we recognized a gain on the sale of an investment in an unconsolidated entity of approximately $2.9 million and contingent interest of approximately $5.1 million. No Tier 2 income was paid to the General Partner for these items as the maximum annual Tier 2 distribution was met. |
|
|
• |
During the third quarter of 2018, we recognized a gain on the sale of Jade Park (an MF Property) of approximately $4.1 million before direct and indirect expense and contingent interest of approximately $4.2 million. Tier 2 income paid to the General Partner for these items was approximately $2.1 million. |
|
|
• |
During the fourth quarter of 2017, we recognized gains on the sale of approximately $6.7 million, net of income taxes and before direct and indirect expense, from the sale of three MF Properties and contingent interest of approximately $2.9 million. Tier 2 income paid to the General Partner for these items was approximately $874,000. |
|
|
• |
During the second quarter of 2017, we recognized contingent interest of approximately $87,000. |
|
|
11 |
|
|
|
|
|
|
• |
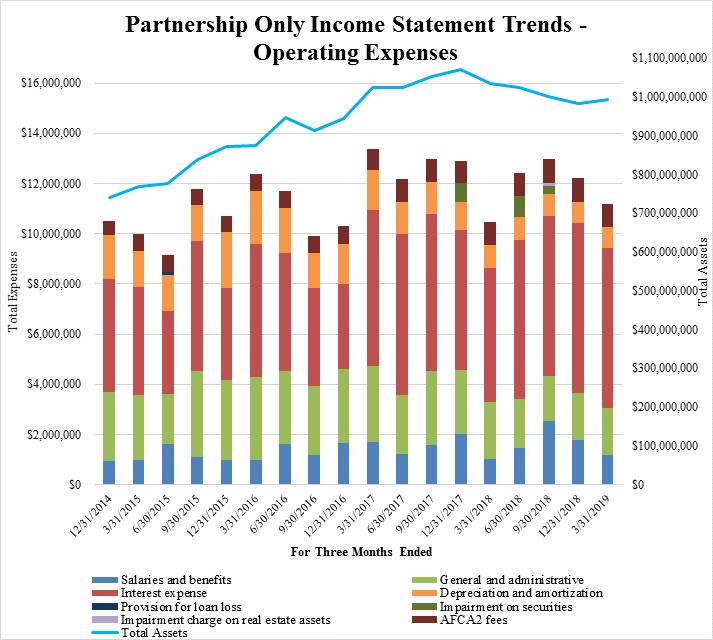
Since April 1, 2017, the ratio of “Salaries and benefits” and “General and administrative” expenses has averaged approximately 0.37% of Total Assets. |
|
|
12 |
|
|
|
|
|
|
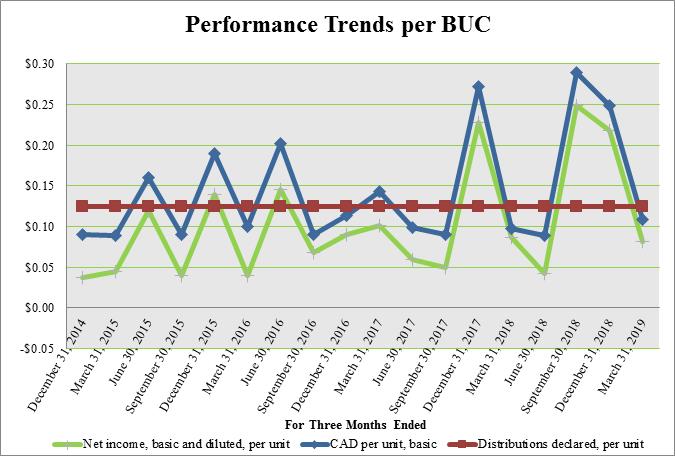
• |
In 2019, we realized approximately $3.0 million of contingent interest. Approximately $753,000 was allocated to the General Partner and approximately $2.3 million was allocated to the BUC holders. |
|
|
• |
In 2018, we realized approximately $9.3 million of contingent interest, gains on sale of real estate assets of approximately $4.1 million, and gains on sale of an investment in an unconsolidated entity of approximately $2.9 million. Approximately $2.1 million was allocated to the General Partner and approximately $14.2 million was allocated to the BUC holders. |
|
|
• |
In 2017, we realized approximately $3.1 million of contingent interest and gains on sale of real estate assets of approximately $10.9 million, net of tax. Approximately $2.0 million was allocated to the General Partner and approximately $12.0 million was allocated to the BUC holders. |
|
|
13 |
|
|
|
|
|
OTHER PARTNERSHIP INFORMATION |
|||||
|
|
|
|
|
||
|
Corporate Office: |
|
|
Transfer Agent:
|
||
|
1004 Farnam Street |
|
|
American Stock Transfer & Trust Company |
||
|
Suite 400 |
|
|
59 Maiden Lane |
||
|
Omaha, NE 68102 |
|
|
Plaza Level |
||
|
Phone: |
402-444-1630 |
|
New York, NY 10038 |
||
|
Investor Services: |
402-930-3098 |
|
|
Phone: 718-921-8124 |
|
|
K-1 Services: |
855-4AT-AXK1 |
|
|
888-991-9902 |
|
|
Fax: |
402-930-3047 |
|
|
Fax:718-236-2641 |
|
|
Web Site: |
www.ataxfund.com |
|
|
|
|
|
K-1 Services Email: |
k1s@ataxfund.com |
|
|
|
|
|
Ticker Symbol: |
ATAX |
|
|
|
|
|
Corporate Counsel: |
|
Independent Accountants: |
|
Barnes & Thornburg LLP |
|
PwC |
|
11 S. Meridian Street |
|
1 North Wacker Drive |
|
Indianapolis, IN 46204 |
|
Chicago, Illinois 60606 |
|
|
|
|
|
Burlington Capital LLC, General Partner of the General Partner for ATAX
Board of Managers |
||
|
|
|
|
|
Michael B. Yanney |
|
Chairman Emeritus of the Board |
|
Lisa Y. Roskens |
|
Chairman of the Board |
|
Dr. William S. Carter |
|
Manager |
|
Patrick J. Jung |
|
Manager |
|
George Krauss |
|
Manager |
|
Dr. Gail Yanney |
|
Manager |
|
Walter K. Griffith |
|
Manager |
|
Senator Michael Johanns |
|
Manager |
|
|
|
|
|
Corporate Officers |
||
|
Chief Executive Officer – Chad L. Daffer |
||
|
Chief Financial Officer – Craig S. Allen |
||
|
|
14 |


|
Partnership Financial Statements and Information Schedules |
|
|
|
|
AMERICA FIRST MULTIFAMILY INVESTORS, L.P. BALANCE SHEETS
|
|
|
March 31, 2019 |
|
|
December 31, 2018 |
|
||
|
Assets |
|
|
|
|
|
|
|
|
|
Cash and cash equivalents |
$ |
|
38,210,497 |
|
$ |
|
32,001,925 |
|
|
Restricted cash |
|
|
792,321 |
|
|
|
1,266,686 |
|
|
Interest receivable, net |
|
|
7,675,314 |
|
|
|
7,011,839 |
|
|
Mortgage revenue bonds held in trust, at fair value |
|
|
656,062,961 |
|
|
|
645,258,873 |
|
|
Mortgage revenue bonds, at fair value |
|
|
82,984,880 |
|
|
|
86,894,562 |
|
|
Public housing capital fund trusts, at fair value |
|
|
46,406,868 |
|
|
|
48,672,086 |
|
|
Real estate assets: |
|
|
|
|
|
|
|
|
|
Land and improvements |
|
|
4,971,665 |
|
|
|
4,971,665 |
|
|
Buildings and improvements |
|
|
71,949,453 |
|
|
|
71,897,070 |
|
|
Real estate assets before accumulated depreciation |
|
|
76,921,118 |
|
|
|
76,868,735 |
|
|
Accumulated depreciation |
|
|
(13,088,741 |
) |
|
|
(12,272,387 |
) |
|
Net real estate assets |
|
|
63,832,377 |
|
|
|
64,596,348 |
|
|
Investments in unconsolidated entities |
|
|
84,684,982 |
|
|
|
76,534,306 |
|
|
Property loans, net of loan loss allowance |
|
|
7,593,377 |
|
|
|
15,961,012 |
|
|
Other assets |
|
|
4,954,602 |
|
|
|
4,515,609 |
|
|
Total Assets |
$ |
|
993,198,179 |
|
$ |
|
982,713,246 |
|
|
|
|
|
|
|
|
|
|
|
|
Liabilities |
|
|
|
|
|
|
|
|
|
Accounts payable, accrued expenses and other liabilities |
$ |
|
9,030,207 |
|
$ |
|
7,543,822 |
|
|
Distribution payable |
|
|
8,393,271 |
|
|
|
7,576,167 |
|
|
Unsecured lines of credit |
|
|
35,659,200 |
|
|
|
35,659,200 |
|
|
Debt financing, net |
|
|
508,248,469 |
|
|
|
505,663,565 |
|
|
Mortgages payable and other secured financing, net |
|
|
27,373,224 |
|
|
|
27,454,375 |
|
|
Total Liabilities |
|
|
588,704,371 |
|
|
|
583,897,129 |
|
|
Redeemable preferred units |
|
|
94,359,389 |
|
|
|
94,350,376 |
|
|
Partners' Capital |
|
|
|
|
|
|
|
|
|
General Partner |
|
|
401,277 |
|
|
|
344,590 |
|
|
Beneficial Unit Certificate holders |
|
|
309,733,142 |
|
|
|
304,121,151 |
|
|
Total Partners' Capital |
|
|
310,134,419 |
|
|
|
304,465,741 |
|
|
Total Liabilities and Partners' Capital |
$ |
|
993,198,179 |
|
$ |
|
982,713,246 |
|
|
|
|
|
|
|
|
|
|
|
|
|
16 |
|
|
|
|
AMERICA FIRST MULTIFAMILY INVESTORS, L.P. INCOME STATEMENTS
|
|
|
For The Three Months Ended March 31, 2019 |
|
|
For The Three Months Ended March 31, 2018 |
|
|
Revenues: |
|
|
|
|
|
|
|
Investment income |
$ |
12,407,876 |
|
$ |
13,378,486 |
|
|
Property revenues |
|
1,993,629 |
|
|
2,336,512 |
|
|
Contingent interest income |
|
3,012,102 |
|
|
- |
|
|
Other interest income |
|
222,238 |
|
|
743,036 |
|
|
Other income |
|
28,753 |
|
|
- |
|
|
Total Revenues |
|
17,664,598 |
|
|
16,458,034 |
|
|
Expenses: |
|
|
|
|
|
|
|
Real estate operating (exclusive of items shown below) |
|
1,176,818 |
|
|
1,395,493 |
|
|
Depreciation and amortization |
|
820,808 |
|
|
906,315 |
|
|
Interest expense |
|
6,394,920 |
|
|
5,347,077 |
|
|
General and administrative |
|
2,778,591 |
|
|
2,811,845 |
|
|
Total Expenses |
|
11,171,137 |
|
|
10,460,730 |
|
|
Income before income taxes |
|
6,493,461 |
|
|
5,997,304 |
|
|
Income tax expense (benefit) |
|
41,648 |
|
|
(7,000) |
|
|
Net income - ATAX Partnership |
$ |
6,451,813 |
|
$ |
6,004,304 |
|
|
|
|
|
|
|
|
|
|
Net income - ATAX Partnership |
|
6,451,813 |
|
|
6,004,304 |
|
|
Redeemable preferred unit distributions and accretion |
|
(717,763) |
|
|
(717,763) |
|
|
Net income available to Partners |
$ |
5,734,050 |
|
$ |
5,286,541 |
|
|
|
|
|
|
|
|
|
|
Selected Segment Data (Partnership): |
|
|
|
|
|
|
|
Revenue and Other Income |
|
|
|
|
|
|
|
Mortgage Revenue Bond Investments |
$ |
10,443,413 |
|
$ |
12,070,556 |
|
|
MF Properties |
|
1,993,629 |
|
|
2,336,512 |
|
|
Public Housing Capital Fund Trusts |
|
638,146 |
|
|
620,106 |
|
|
Other Investments |
|
4,589,410 |
|
|
1,430,860 |
|
|
Total Revenue and Other Income |
$ |
17,664,598 |
|
$ |
16,458,034 |
|
|
Expenses |
|
|
|
|
|
|
|
Mortgage Revenue Bond Investments |
$ |
8,400,059 |
|
$ |
7,770,961 |
|
|
MF Properties |
|
2,430,763 |
|
|
2,699,242 |
|
|
Public Housing Capital Fund Trusts |
|
381,963 |
|
|
(26,016) |
|
|
Other Investments |
|
- |
|
|
9,543 |
|
|
Total Expenses |
$ |
11,212,785 |
|
$ |
10,453,730 |
|
|
Net Income (loss) - ATAX Partnership |
|
|
|
|
|
|
|
Mortgage Revenue Bond Investments |
$ |
2,043,354 |
|
$ |
4,299,595 |
|
|
MF Properties |
|
(437,134) |
|
|
(362,730) |
|
|
Public Housing Capital Fund Trusts |
|
256,183 |
|
|
646,122 |
|
|
Other Investments |
|
4,589,410 |
|
|
1,421,317 |
|
|
Income from continuing operations |
$ |
6,451,813 |
|
$ |
6,004,304 |
|
|
|
|
|
|
|
|
|
|
|
17 |
|
|
|
|
AMERICA FIRST MULTIFAMILY INVESTORS, L.P.
CASH AVAILABLE FOR DISTRIBUTION (CAD) AND OTHER PERFORMANCE MEASURES
FOR THE THREE MONTHS ENDED
The following table contains reconciliations of the Partnership’s GAAP net income to its CAD:
|
|
March 31, 2019 |
|
December 31, 2018 |
|
September 30, 2018 |
|
June 30, 2018 |
|
March 31, 2018 |
|
December 31, 2017 |
|
September 30, 2017 |
|
June 30, 2017 |
|
||||||||
|
|
|
|
|
|
|
|
|
|
|
|
|
|
|
|
|
|
|
|
|
|
|
|
|
|
|
Partnership net income |
$ |
6,451,813 |
|
$ |
13,914,049 |
|
$ |
17,883,055 |
|
$ |
3,338,121 |
|
$ |
6,004,304 |
|
$ |
15,647,453 |
|
$ |
3,545,483 |
|
$ |
4,109,400 |
|
|
Change in fair value of derivatives and interest rate derivative amortization |
|
306,591 |
|
|
363,481 |
|
|
(91,679 |
) |
|
(6,386 |
) |
|
(989,995 |
) |
|
(129,595 |
) |
|
66,917 |
|
|
181,420 |
|
|
Depreciation and amortization expense |
|
820,808 |
|
|
863,534 |
|
|
864,600 |
|
|
921,816 |
|
|
906,315 |
|
|
1,090,599 |
|
|
1,259,055 |
|
|
1,270,379 |
|
|
Impairment of securities |
|
- |
|
|
- |
|
|
309,958 |
|
|
831,062 |
|
|
- |
|
|
761,960 |
|
|
- |
|
|
- |
|
|
Impairment charge on real estate assets |
|
- |
|
|
- |
|
|
150,000 |
|
|
- |
|
|
- |
|
|
- |
|
|
- |
|
|
- |
|
|
Amortization of deferred financing costs |
|
361,305 |
|
|
368,165 |
|
|
409,420 |
|
|
430,687 |
|
|
464,772 |
|
|
444,299 |
|
|
577,413 |
|
|
562,585 |
|
|
Restricted units compensation expense |
|
184,184 |
|
|
450,141 |
|
|
622,227 |
|
|
543,521 |
|
|
206,636 |
|
|
455,119 |
|
|
550,390 |
|
|
438,893 |
|
|
Deferred income taxes |
|
(40,692 |
) |
|
(276,235 |
) |
|
- |
|
|
- |
|
|
34,000 |
|
|
(26,000 |
) |
|
(9,000 |
) |
|
(201,000 |
) |
|
Redeemable Series A Preferred Unit distribution and accretion |
|
(717,763 |
) |
|
(717,762 |
) |
|
(717,763 |
) |
|
(717,762 |
) |
|
(717,763 |
) |
|
(701,664 |
) |
|
(523,682 |
) |
|
(432,550 |
) |
|
Bond purchase premium (discount) amortization (accretion), net of cash received |
|
(38,952 |
) |
|
(3,214 |
) |
|
(3,513 |
) |
|
(3,808 |
) |
|
(4,098 |
) |
|
(193,530 |
) |
|
(26,270 |
) |
|
(26,741 |
) |
|
Tier 2 Income distributable to the General Partner |
|
(753,025 |
) |
|
12,263 |
|
|
(2,074,381 |
) |
|
- |
|
|
- |
|
|
(873,893 |
) |
|
- |
|
|
(16,224 |
) |
|
CAD |
$ |
6,574,269 |
|
$ |
14,974,422 |
|
$ |
17,351,924 |
|
$ |
5,337,251 |
|
$ |
5,904,171 |
|
$ |
16,474,748 |
|
$ |
5,440,306 |
|
$ |
5,886,162 |
|
|
|
|
|
|
|
|
|
|
|
|
|
|
|
|
|
|
|
|
|
|
|
|
|
|
|
|
Weighted average number of BUCs outstanding, basic |
|
60,426,177 |
|
|
60,143,725 |
|
|
59,907,123 |
|
|
59,937,300 |
|
|
60,124,333 |
|
|
59,895,229 |
|
|
59,811,578 |
|
|
59,862,969 |
|
|
|
|
|
|
|
|
|
|
|
|
|
|
|
|
|
|
|
|
|
|
|
|
|
|
|
|
Partnership Only: |
|
|
|
|
|
|
|
|
|
|
|
|
|
|
|
|
|
|
|
|
|
|
|
|
|
Net income, basic and diluted, per BUC |
$ |
0.08 |
|
$ |
0.22 |
|
$ |
0.25 |
|
$ |
0.04 |
|
$ |
0.09 |
|
$ |
0.23 |
|
$ |
0.05 |
|
$ |
0.06 |
|
|
CAD per BUC, basic |
$ |
0.11 |
|
$ |
0.25 |
|
$ |
0.29 |
|
$ |
0.09 |
|
$ |
0.10 |
|
$ |
0.27 |
|
$ |
0.09 |
|
$ |
0.10 |
|
|
Distributions declared, per BUC |
$ |
0.125 |
|
$ |
0.125 |
|
$ |
0.125 |
|
$ |
0.125 |
|
$ |
0.125 |
|
$ |
0.125 |
|
$ |
0.125 |
|
$ |
0.125 |
|
|
|
|
|
|
|
|
|
|
|
|
|
|
|
|
|
|
|
|
|
|
|
|
|
|
|
|
|
18 |
|
|
|
|
AMERICA FIRST MULTIFAMILY INVESTORS, L.P.
MORTGAGE REVENUE BOND INVESTMENT SCHEDULE
MARCH 31, 2019
|
|
|
|
|
|
|
Base |
|
|
|
|
|
|
|
|
|
|
|
|
|
|
|
Maturity |
|
Interest |
|
|
Principal |
|
|
Estimated |
|
|||
|
Property Name |
|
Location |
|
Date |
|
Rate |
|
|
Outstanding |
|
|
Fair Value |
|
|||
|
|
|
|
|
|
|
|
|
|
|
|
|
|
|
|
|
|
|
15 West Apartments |
|
Vancouver, WA |
|
7/1/2054 |
|
|
6.25 |
% |
|
$ |
9,721,717 |
|
|
$ |
11,298,714 |
|
|
Arbors at Hickory Ridge |
|
Memphis, TN |
|
1/1/2049 |
|
|
6.25 |
% |
|
|
11,083,800 |
|
|
|
12,683,298 |
|
|
Avistar on the Boulevard - Series A |
|
San Antonio, TX |
|
3/1/2050 |
|
|
6.00 |
% |
|
|
15,897,526 |
|
|
|
17,740,257 |
|
|
Avistar at the Crest - Series A |
|
San Antonio, TX |
|
3/1/2050 |
|
|
6.00 |
% |
|
|
9,331,681 |
|
|
|
10,493,596 |
|
|
Avistar (February 2013 Acquisition) - Series B (2 Bonds) |
|
San Antonio, TX |
|
4/1/2050 |
|
|
9.00 |
% |
|
|
1,186,525 |
|
|
|
1,279,267 |
|
|
Avistar at the Oaks - Series A |
|
San Antonio, TX |
|
8/1/2050 |
|
|
6.00 |
% |
|
|
7,538,088 |
|
|
|
8,357,177 |
|
|
Avistar in 09 - Series A |
|
San Antonio, TX |
|
8/1/2050 |
|
|
6.00 |
% |
|
|
6,508,847 |
|
|
|
7,103,751 |
|
|
Avistar on the Hills - Series A |
|
San Antonio, TX |
|
8/1/2050 |
|
|
6.00 |
% |
|
|
5,208,048 |
|
|
|
5,819,571 |
|
|
Avistar (June 2013 Acquisition) - Series B (2 Bonds) |
|
San Antonio, TX |
|
9/1/2050 |
|
|
9.00 |
% |
|
|
993,773 |
|
|
|
1,050,998 |
|
|
Avistar at Copperfield - Series A |
|
Houston, TX |
|
5/1/2054 |
|
|
5.75 |
% |
|
|
10,000,000 |
|
|
|
10,712,262 |
|
|
Avistar at Copperfield - Series B |
|
Houston, TX |
|
6/1/2054 |
|
|
12.00 |
% |
|
|
4,000,000 |
|
|
|
4,014,008 |
|
|
Avistar at the Parkway - Series A |
|
San Antonio, TX |
|
5/1/2052 |
|
|
6.00 |
% |
|
|
13,083,475 |
|
|
|
14,601,702 |
|
|
Avistar at the Parkway - Series B |
|
San Antonio, TX |
|
6/1/2052 |
|
|
12.00 |
% |
|
|
124,529 |
|
|
|
159,142 |
|
|
Avistar at Wilcrest - Series A |
|
Houston, TX |
|
5/1/2054 |
|
|
5.75 |
% |
|
|
3,775,000 |
|
|
|
4,042,279 |
|
|
Avistar at Wilcrest - Series B |
|
Houston, TX |
|
6/1/2054 |
|
|
12.00 |
% |
|
|
1,550,000 |
|
|
|
1,555,292 |
|
|
Avistar at Wood Hollow - Series A |
|
Austin, TX |
|
5/1/2054 |
|
|
5.75 |
% |
|
|
31,850,000 |
|
|
|
33,993,030 |
|
|
Avistar at Wood Hollow - Series B |
|
Austin, TX |
|
6/1/2054 |
|
|
12.00 |
% |
|
|
8,410,000 |
|
|
|
8,440,947 |
|
|
Bridle Ridge |
|
Greer, SC |
|
1/1/2043 |
|
|
6.00 |
% |
|
|
7,355,000 |
|
|
|
7,401,949 |
|
|
Brookstone |
|
Waukegan, IL |
|
5/1/2040 |
|
|
5.45 |
% |
|
|
8,849,684 |
|
|
|
9,439,217 |
|
|
Bruton |
|
Dallas, TX |
|
8/1/2054 |
|
|
6.00 |
% |
|
|
17,902,767 |
|
|
|
20,308,711 |
|
|
Columbia Gardens |
|
Columbia, SC |
|
12/1/2050 |
|
|
5.50 |
% |
|
|
13,027,000 |
|
|
|
14,863,224 |
|
|
Companion at Thornhill Apartments |
|
Lexington, SC |
|
1/1/2052 |
|
|
5.80 |
% |
|
|
11,266,464 |
|
|
|
12,483,955 |
|
|
Concord at Gulfgate - Series A |
|
Houston, TX |
|
2/1/2032 |
|
|
6.00 |
% |
|
|
19,103,188 |
|
|
|
21,817,693 |
|
|
Concord at Little York - Series A |
|
Houston, TX |
|
2/1/2032 |
|
|
6.00 |
% |
|
|
13,382,687 |
|
|
|
15,345,192 |
|
|
Concord at Williamcrest - Series A |
|
Houston, TX |
|
2/1/2032 |
|
|
6.00 |
% |
|
|
20,731,216 |
|
|
|
23,677,059 |
|
|
Copper Gate Apartments |
|
Lafayette, IN |
|
12/1/2029 |
|
|
6.25 |
% |
|
|
5,055,000 |
|
|
|
5,723,044 |
|
|
Courtyard Apartments - Series A |
|
Fullerton, CA |
|
12/1/2033 |
|
|
5.00 |
% |
|
|
10,209,805 |
|
|
|
11,234,966 |
|
|
Courtyard Apartments - Series B |
|
Fullerton, CA |
|
6/1/2019 |
|
|
8.00 |
% |
|
|
6,228,000 |
|
|
|
6,228,251 |
|
|
Cross Creek |
|
Beaufort, SC |
|
3/1/2049 |
|
|
6.15 |
% |
|
|
8,047,878 |
|
|
|
8,700,520 |
|
|
Crossing at 1415 - Series A |
|
San Antonio, TX |
|
12/1/2052 |
|
|
6.00 |
% |
|
|
7,457,776 |
|
|
|
8,158,466 |
|
|
Decatur Angle |
|
Fort Worth, TX |
|
1/1/2054 |
|
|
5.75 |
% |
|
|
22,587,594 |
|
|
|
24,999,162 |
|
|
Esperanza at Palo Alto |
|
San Antonio, TX |
|
7/1/2058 |
|
|
5.80 |
% |
|
|
19,455,730 |
|
|
|
22,258,844 |
|
|
Gateway Village |
|
Durham, NC |
|
4/1/2032 |
|
|
6.10 |
% |
|
|
2,600,000 |
|
|
|
2,914,632 |
|
|
Glenview - Series A |
|
Cameron Park, CA |
|
12/1/2031 |
|
|
5.75 |
% |
|
|
4,570,194 |
|
|
|
5,190,982 |
|
|
Greens of Pine Glen - Series A |
|
Durham, NC |
|
10/1/2047 |
|
|
6.50 |
% |
|
|
8,008,000 |
|
|
|
8,857,812 |
|
|
Greens of Pine Glen - Series B |
|
Durham, NC |
|
10/1/2047 |
|
|
12.00 |
% |
|
|
932,993 |
|
|
|
1,083,658 |
|
|
Harden Ranch - Series A |
|
Salinas, CA |
|
3/1/2030 |
|
|
5.75 |
% |
|
|
6,757,247 |
|
|
|
7,800,403 |
|
|
Harmony Court Bakersfield - Series A |
|
Bakersfield, CA |
|
12/1/2033 |
|
|
5.00 |
% |
|
|
3,722,637 |
|
|
|
4,061,548 |
|
|
Harmony Terrace - Series A |
|
Simi Valley, CA |
|
1/1/2034 |
|
|
5.00 |
% |
|
|
6,890,938 |
|
|
|
7,619,360 |
|
|
Heights at 515 - Series A |
|
San Antonio, TX |
|
12/1/2052 |
|
|
6.00 |
% |
|
|
6,827,722 |
|
|
|
7,641,130 |
|
|
Heritage Square - Series A |
|
Edinburg, TX |
|
9/1/2051 |
|
|
6.00 |
% |
|
|
10,777,579 |
|
|
|
11,877,771 |
|
|
Las Palmas II - Series A |
|
Coachella, CA |
|
11/1/2033 |
|
|
5.00 |
% |
|
|
1,689,400 |
|
|
|
1,850,170 |
|
|
|
19 |
|
|
|
|
|
|
|
|
|
|
|
Base |
|
|
|
|
|
|
|
|
|
|
|
|
|
|
|
Maturity |
|
Interest |
|
|
Principal |
|
|
Estimated |
|
|||
|
Property Name |
|
Location |
|
Date |
|
Rate |
|
|
Outstanding |
|
|
Fair Value |
|
|||
|
|
|
|
|
|
|
|
|
|
|
|
|
|
|
|
|
|
|
Live 929 |
|
Baltimore, MD |
|
7/1/2049 |
|
|
5.78 |
% |
|
|
39,830,000 |
|
|
|
42,296,320 |
|
|
Lynnhaven Apartments |
|
Durham, NC |
|
4/1/2032 |
|
|
6.10 |
% |
|
|
3,450,000 |
|
|
|
3,795,712 |
|
|
Montclair - Series A |
|
Lemoore, CA |
|
12/1/2031 |
|
|
5.75 |
% |
|
|
2,475,929 |
|
|
|
2,793,624 |
|
|
Montecito at Williams Ranch - Series A |
|
Salinas, CA |
|
10/1/2034 |
|
|
5.50 |
% |
|
|
7,690,000 |
|
|
|
8,780,812 |
|
|
Oaks at Georgetown - Series A |
|
Georgetown, TX |
|
1/1/2034 |
|
|
5.00 |
% |
|
|
12,313,807 |
|
|
|
13,153,057 |
|
|
Ohio Bond - Series A |
|
Ohio |
|
6/1/2050 |
|
|
7.00 |
% |
|
|
13,956,000 |
|
|
|
14,082,387 |
|
|
Ohio Bond - Series B |
|
Ohio |
|
6/1/2050 |
|
|
10.00 |
% |
|
|
3,516,859 |
|
|
|
3,544,104 |
|
|
Pro Nova - 2014-1 |
|
Knoxville, TN |
|
5/1/2034 |
|
|
6.00 |
% |
|
|
10,000,000 |
|
|
|
9,612,000 |
|
|
Renaissance - Series A |
|
Baton Rouge, LA |
|
6/1/2050 |
|
|
6.00 |
% |
|
|
11,093,792 |
|
|
|
11,783,191 |
|
|
Rosewood Townhomes - Series A |
|
Goose Creek, SC |
|
7/1/2055 |
|
|
5.75 |
% |
|
|
9,280,000 |
|
|
|
8,828,138 |
|
|
Rosewood Townhomes - Series B |
|
Goose Creek, SC |
|
8/1/2055 |
|
|
12.00 |
% |
|
|
470,000 |
|
|
|
471,438 |
|
|
Runnymede |
|
Austin, TX |
|
10/1/2042 |
|
|
6.00 |
% |
|
|
10,040,000 |
|
|
|
10,175,058 |
|
|
San Vicente - Series A |
|
Soledad, CA |
|
11/1/2033 |
|
|
5.00 |
% |
|
|
3,483,453 |
|
|
|
3,814,952 |
|
|
Santa Fe - Series A |
|
Hesperia, CA |
|
12/1/2031 |
|
|
5.75 |
% |
|
|
2,999,495 |
|
|
|
3,452,584 |
|
|
Seasons at Simi Valley - Series A |
|
Simi Valley, CA |
|
9/1/2032 |
|
|
5.75 |
% |
|
|
4,315,002 |
|
|
|
5,059,439 |
|
|
Seasons Lakewood - Series A |
|
Lakewood, CA |
|
1/1/2034 |
|
|
5.00 |
% |
|
|
7,340,347 |
|
|
|
8,081,417 |
|
|
Seasons San Juan Capistrano - Series A |
|
San Juan Capistrano, CA |
|
1/1/2034 |
|
|
5.00 |
% |
|
|
12,358,748 |
|
|
|
13,606,468 |
|
|
Silver Moon - Series A |
|
Albuquerque, NM |
|
8/1/2055 |
|
|
6.00 |
% |
|
|
7,807,824 |
|
|
|
8,859,946 |
|
|
Solano Vista - Series A |
|
Vallejo, CA |
|
1/1/2036 |
|
|
5.85 |
% |
|
|
2,665,000 |
|
|
|
3,150,348 |
|
|
Solano Vista - Series B |
|
Vallejo, CA |
|
1/1/2021 |
|
|
5.85 |
% |
|
|
3,103,000 |
|
|
|
3,097,298 |
|
|
South Pointe - Series A |
|
Hanahan, SC |
|
7/1/2055 |
|
|
5.75 |
% |
|
|
21,600,000 |
|
|
|
20,639,412 |
|
|
South Pointe - Series B |
|
Hanahan, SC |
|
8/1/2055 |
|
|
12.00 |
% |
|
|
1,100,000 |
|
|
|
1,102,830 |
|
|
Southpark |
|
Austin, TX |
|
12/1/2049 |
|
|
6.13 |
% |
|
|
13,155,000 |
|
|
|
14,078,366 |
|
|
Summerhill - Series A |
|
Bakersfield, CA |
|
12/1/2033 |
|
|
5.00 |
% |
|
|
6,410,320 |
|
|
|
6,993,919 |
|
|
Sycamore Walk - Series A |
|
Bakersfield, CA |
|
1/1/2033 |
|
|
5.25 |
% |
|
|
3,588,448 |
|
|
|
4,001,385 |
|
|
The Palms at Premier Park |
|
Columbia, SC |
|
1/1/2050 |
|
|
6.25 |
% |
|
|
18,994,280 |
|
|
|
21,231,510 |
|
|
The Village at Madera - Series A |
|
Madera, CA |
|
12/1/2033 |
|
|
5.00 |
% |
|
|
3,078,910 |
|
|
|
3,359,216 |
|
|
Tyler Park Townhomes |
|
Greenfield, CA |
|
1/1/2030 |
|
|
5.75 |
% |
|
|
5,887,277 |
|
|
|
6,628,897 |
|
|
Village at Avalon |
|
Albuquerque, NM |
|
1/1/2059 |
|
|
5.80 |
% |
|
|
16,382,573 |
|
|
|
18,339,749 |
|
|
Village at River's Edge |
|
Columbia, SC |
|
6/1/2033 |
|
|
6.00 |
% |
|
|
9,921,985 |
|
|
|
11,539,612 |
|
|
Vineyard Gardens - Series A |
|
Oxnard, CA |
|
1/1/2035 |
|
|
5.50 |
% |
|
|
3,995,000 |
|
|
|
4,571,050 |
|
|
Westside Village Market |
|
Shafter, CA |
|
1/1/2030 |
|
|
5.75 |
% |
|
|
3,847,324 |
|
|
|
4,353,684 |
|
|
Willow Run |
|
Columbia, SC |
|
12/1/2050 |
|
|
5.50 |
% |
|
|
12,846,000 |
|
|
|
14,656,611 |
|
|
Woodlynn Village |
|
Maplewood, MN |
|
11/1/2042 |
|
|
6.00 |
% |
|
|
4,221,000 |
|
|
|
4,230,297 |
|
|
Total Mortgage Revenue Bonds |
|
|
|
|
|
|
|
|
|
$ |
676,916,881 |
|
|
$ |
739,047,841 |
|
|
|
20 |
|
|
|
|
OTHER INVESTMENTS
MARCH 31, 2019
|
|
|
|
|
Weighted |
|
|
Weighted Avg. |
|
|
|
|
|
|
|
||||
|
Name |
|
|
|
Average Lives |
|
|
Coupon Rate |
|
|
Principal Outstanding |
|
|
Estimated Fair Value |
|
||||
|
|
|
|
|
|
|
|
|
|
|
|
|
|
|
|
|
|
|
|
|
Public Housing Capital Fund Trust Certificate I |
|
|
|
6.24 |
|
|
|
5.38 |
% |
|
$ |
24,913,137 |
|
|
$ |
24,866,898 |
|
|
|
Public Housing Capital Fund Trust Certificate II |
|
|
|
|
3.37 |
|
|
|
4.35 |
% |
|
|
6,769,666 |
|
|
|
6,676,265 |
|
|
Public Housing Capital Fund Trust Certificate III |
|
|
|
6.51 |
|
|
|
5.30 |
% |
|
|
15,199,430 |
|
|
|
14,863,705 |
|
|
|
|
|
|
|
|
|
|
|
|
|
|
|
$ |
46,882,233 |
|
|
$ |
46,406,868 |
|
|
|
21 |
|
|
|
|
AMERICA FIRST MULTIFAMILY INVESTORS, L.P.
MORTGAGE REVENUE BOND INVESTMENT SCHEDULE
DECEMBER 31, 2018
|
|
|
|
|
|
|
Base |
|
|
|
|
|
|
|
|
|
|
|
|
|
|
|
Maturity |
|
Interest |
|
|
Principal |
|
|
Estimated |
|
|||
|
Property Name |
|
Location |
|
Date |
|
Rate |
|
|
Outstanding |
|
|
Fair Value |
|
|||
|
|
|
|
|
|
|
|
|
|
|
|
|
|
|
|
|
|
|
15 West Apartments |
|
Vancouver, WA |
|
7/1/2054 |
|
|
6.25 |
% |
|
$ |
9,737,418 |
|
|
$ |
11,217,907 |
|
|
Arbors at Hickory Ridge |
|
Memphis, TN |
|
1/1/2049 |
|
|
6.25 |
% |
|
|
11,115,410 |
|
|
|
12,594,151 |
|
|
Avistar on the Boulevard - Series A |
|
San Antonio, TX |
|
3/1/2050 |
|
|
6.00 |
% |
|
|
15,941,296 |
|
|
|
17,569,565 |
|
|
Avistar at the Crest - Series A |
|
San Antonio, TX |
|
3/1/2050 |
|
|
6.00 |
% |
|
|
9,357,374 |
|
|
|
10,393,662 |
|
|
Avistar (February 2013 Acquisition) - Series B (2 Bonds) |
|
San Antonio, TX |
|
4/1/2050 |
|
|
9.00 |
% |
|
|
1,188,251 |
|
|
|
1,266,240 |
|
|
Avistar at the Oaks - Series A |
|
San Antonio, TX |
|
8/1/2050 |
|
|
6.00 |
% |
|
|
7,558,240 |
|
|
|
8,265,210 |
|
|
Avistar in 09 - Series A |
|
San Antonio, TX |
|
8/1/2050 |
|
|
6.00 |
% |
|
|
6,526,247 |
|
|
|
7,052,186 |
|
|
Avistar on the Hills - Series A |
|
San Antonio, TX |
|
8/1/2050 |
|
|
6.00 |
% |
|
|
5,221,971 |
|
|
|
5,779,055 |
|
|
Avistar (June 2013 Acquisition) - Series B (2 Bonds) |
|
San Antonio, TX |
|
9/1/2050 |
|
|
9.00 |
% |
|
|
995,162 |
|
|
|
1,042,642 |
|
|
Avistar at Copperfield - Series A |
|
Houston, TX |
|
5/1/2054 |
|
|
5.75 |
% |
|
|
10,000,000 |
|
|
|
10,589,196 |
|
|
Avistar at Copperfield - Series B |
|
Houston, TX |
|
6/1/2054 |
|
|
12.00 |
% |
|
|
4,000,000 |
|
|
|
4,011,730 |
|
|
Avistar at the Parkway - Series A |
|
San Antonio, TX |
|
5/1/2052 |
|
|
6.00 |
% |
|
|
13,114,418 |
|
|
|
14,346,710 |
|
|
Avistar at the Parkway - Series B |
|
San Antonio, TX |
|
6/1/2052 |
|
|
12.00 |
% |
|
|
124,600 |
|
|
|
156,820 |
|
|
Avistar at Wilcrest - Series A |
|
Houston, TX |
|
5/1/2054 |
|
|
5.75 |
% |
|
|
3,775,000 |
|
|
|
3,981,263 |
|
|
Avistar at Wilcrest - Series B |
|
Houston, TX |
|
6/1/2054 |
|
|
12.00 |
% |
|
|
1,550,000 |
|
|
|
1,554,013 |
|
|
Avistar at Wood Hollow - Series A |
|
Austin, TX |
|
5/1/2054 |
|
|
5.75 |
% |
|
|
31,850,000 |
|
|
|
33,474,687 |
|
|
Avistar at Wood Hollow - Series B |
|
Austin, TX |
|
6/1/2054 |
|
|
12.00 |
% |
|
|
8,410,000 |
|
|
|
8,433,940 |
|
|
Bridle Ridge |
|
Greer, SC |
|
1/1/2043 |
|
|
6.00 |
% |
|
|
7,395,000 |
|
|
|
7,485,349 |
|
|
Brookstone |
|
Waukegan, IL |
|
5/1/2040 |
|
|
5.45 |
% |
|
|
8,876,298 |
|
|
|
9,388,086 |
|
|
Bruton |
|
Dallas, TX |
|
8/1/2054 |
|
|
6.00 |
% |
|
|
17,933,482 |
|
|
|
19,979,538 |
|
|
Columbia Gardens |
|
Columbia, SC |
|
12/1/2050 |
|
|
5.50 |
% |
|
|
13,061,000 |
|
|
|
14,619,308 |
|
|
Companion at Thornhill Apartments |
|
Lexington, SC |
|
1/1/2052 |
|
|
5.80 |
% |
|
|
11,294,928 |
|
|
|
12,443,147 |
|
|
Concord at Gulfgate - Series A |
|
Houston, TX |
|
2/1/2032 |
|
|
6.00 |
% |
|
|
19,144,400 |
|
|
|
21,366,955 |
|
|
Concord at Little York - Series A |
|
Houston, TX |
|
2/1/2032 |
|
|
6.00 |
% |
|
|
13,411,558 |
|
|
|
15,028,775 |
|
|
Concord at Williamcrest - Series A |
|
Houston, TX |
|
2/1/2032 |
|
|
6.00 |
% |
|
|
20,775,940 |
|
|
|
23,281,183 |
|
|
Copper Gate Apartments |
|
Lafayette, IN |
|
12/1/2029 |
|
|
6.25 |
% |
|
|
5,055,000 |
|
|
|
5,698,012 |
|
|
Courtyard Apartments - Series A |
|
Fullerton, CA |
|
12/1/2033 |
|
|
5.00 |
% |
|
|
10,230,000 |
|
|
|
11,184,573 |
|
|
Courtyard Apartments - Series B |
|
Fullerton, CA |
|
6/1/2019 |
|
|
8.00 |
% |
|
|
6,228,000 |
|
|
|
6,230,450 |
|
|
Cross Creek |
|
Beaufort, SC |
|
3/1/2049 |
|
|
6.15 |
% |
|
|
8,072,754 |
|
|
|
8,684,868 |
|
|
Crossing at 1415 - Series A |
|
San Antonio, TX |
|
12/1/2052 |
|
|
6.00 |
% |
|
|
7,474,716 |
|
|
|
8,075,454 |
|
|
Decatur Angle |
|
Fort Worth, TX |
|
1/1/2054 |
|
|
5.75 |
% |
|
|
22,630,276 |
|
|
|
24,575,792 |
|
|
Esperanza at Palo Alto |
|
San Antonio, TX |
|
7/1/2058 |
|
|
5.80 |
% |
|
|
19,487,713 |
|
|
|
21,838,166 |
|
|
Glenview - Series A |
|
Cameron Park, CA |
|
12/1/2031 |
|
|
5.75 |
% |
|
|
4,581,930 |
|
|
|
5,105,954 |
|
|
Greens of Pine Glen - Series A |
|
Durham, NC |
|
10/1/2047 |
|
|
6.50 |
% |
|
|
8,032,000 |
|
|
|
8,850,686 |
|
|
Greens of Pine Glen - Series B |
|
Durham, NC |
|
10/1/2047 |
|
|
12.00 |
% |
|
|
933,928 |
|
|
|
1,083,717 |
|
|
Harden Ranch - Series A |
|
Salinas, CA |
|
3/1/2030 |
|
|
5.75 |
% |
|
|
6,775,508 |
|
|
|
7,783,065 |
|
|
Harmony Court Bakersfield - Series A |
|
Bakersfield, CA |
|
12/1/2033 |
|
|
5.00 |
% |
|
|
3,730,000 |
|
|
|
4,042,844 |
|
|
Harmony Terrace - Series A |
|
Simi Valley, CA |
|
1/1/2034 |
|
|
5.00 |
% |
|
|
6,900,000 |
|
|
|
7,547,686 |
|
|
Heights at 515 - Series A |
|
San Antonio, TX |
|
12/1/2052 |
|
|
6.00 |
% |
|
|
6,843,232 |
|
|
|
7,565,754 |
|
|
Heritage Square - Series A |
|
Edinburg, TX |
|
9/1/2051 |
|
|
6.00 |
% |
|
|
10,958,661 |
|
|
|
11,852,542 |
|
|
Las Palmas II - Series A |
|
Coachella, CA |
|
11/1/2033 |
|
|
5.00 |
% |
|
|
1,692,774 |
|
|
|
1,833,961 |
|
|
|
22 |
|
|
|
|
|
|
|
|
|
|
|
Base |
|
|
|
|
|
|
|
|
|
|
|
|
|
|
|
Maturity |
|
Interest |
|
|
Principal |
|
|
Estimated |
|
|||
|
Property Name |
|
Location |
|
Date |
|
Rate |
|
|
Outstanding |
|
|
Fair Value |
|
|||
|
|
|
|
|
|
|
|
|
|
|
|
|
|
|
|
|
|
|
Live 929 |
|
Baltimore, MD |
|
7/1/2049 |
|
|
5.78 |
% |
|
|
39,875,000 |
|
|
|
43,114,383 |
|
|
Montclair - Series A |
|
Lemoore, CA |
|
12/1/2031 |
|
|
5.75 |
% |
|
|
2,482,288 |
|
|
|
2,729,040 |
|
|
Montecito at Williams Ranch - Series A |
|
Salinas, CA |
|
10/1/2034 |
|
|
5.50 |
% |
|
|
7,690,000 |
|
|
|
8,663,133 |
|
|
Oaks at Georgetown - Series A |
|
Georgetown, TX |
|
1/1/2034 |
|
|
5.00 |
% |
|
|
12,330,000 |
|
|
|
13,023,579 |
|
|
Ohio Bond - Series A |
|
Ohio |
|
6/1/2050 |
|
|
7.00 |
% |
|
|
13,989,000 |
|
|
|
14,230,675 |
|
|
Ohio Bond - Series B |
|
Ohio |
|
6/1/2050 |
|
|
10.00 |
% |
|
|
3,520,900 |
|
|
|
3,572,234 |
|
|
Pro Nova - 2014-1 |
|
Knoxville, TN |
|
5/1/2034 |
|
|
6.00 |
% |
|
|
10,000,000 |
|
|
|
10,047,123 |
|
|
Renaissance - Series A |
|
Baton Rouge, LA |
|
6/1/2050 |
|
|
6.00 |
% |
|
|
11,123,800 |
|
|
|
12,507,480 |
|
|
Rosewood Townhomes - Series A |
|
Goose Creek, SC |
|
7/1/2055 |
|
|
5.75 |
% |
|
|
9,280,000 |
|
|
|
8,633,821 |
|
|
Rosewood Townhomes - Series B |
|
Goose Creek, SC |
|
8/1/2055 |
|
|
12.00 |
% |
|
|
470,000 |
|
|
|
471,217 |
|
|
Runnymede |
|
Austin, TX |
|
10/1/2042 |
|
|
6.00 |
% |
|
|
10,040,000 |
|
|
|
10,104,280 |
|
|
San Vicente - Series A |
|
Soledad, CA |
|
11/1/2033 |
|
|
5.00 |
% |
|
|
3,490,410 |
|
|
|
3,781,531 |
|
|
Santa Fe - Series A |
|
Hesperia, CA |
|
12/1/2031 |
|
|
5.75 |
% |
|
|
3,007,198 |
|
|
|
3,408,401 |
|
|
Seasons at Simi Valley - Series A |
|
Simi Valley, CA |
|
9/1/2032 |
|
|
5.75 |
% |
|
|
4,325,536 |
|
|
|
4,980,862 |
|
|
Seasons Lakewood - Series A |
|
Lakewood, CA |
|
1/1/2034 |
|
|
5.00 |
% |
|
|
7,350,000 |
|
|
|
8,004,929 |
|
|
Seasons San Juan Capistrano - Series A |
|
San Juan Capistrano, CA |
|
1/1/2034 |
|
|
5.00 |
% |
|
|
12,375,000 |
|
|
|
13,477,687 |
|
|
Seasons San Juan Capistrano - Series B |
|
San Juan Capistrano, CA |
|
1/1/2019 |
|
|
8.00 |
% |
|
|
5,574,000 |
|
|
|
5,572,922 |
|
|
Silver Moon - Series A |
|
Albuquerque, NM |
|
8/1/2055 |
|
|
6.00 |
% |
|
|
7,822,610 |
|
|
|
8,601,550 |
|
|
Solano Vista - Series A |
|
Vallejo, CA |
|
1/1/2036 |
|
|
5.85 |
% |
|
|
2,665,000 |
|
|
|
2,665,000 |
|
|
Solano Vista - Series B |
|
Vallejo, CA |
|
1/1/2021 |
|
|
5.85 |
% |
|
|
3,103,000 |
|
|
|
3,103,000 |
|
|
South Pointe - Series A |
|
Hanahan, SC |
|
7/1/2055 |
|
|
5.75 |
% |
|
|
21,600,000 |
|
|
|
20,185,684 |
|
|
South Pointe - Series B |
|
Hanahan, SC |
|
8/1/2055 |
|
|
12.00 |
% |
|
|
1,100,000 |
|
|
|
1,102,330 |
|
|
Southpark |
|
Austin, TX |
|
12/1/2049 |
|
|
6.13 |
% |
|
|
13,155,000 |
|
|
|
14,106,572 |
|
|
Summerhill - Series A |
|
Bakersfield, CA |
|
12/1/2033 |
|
|
5.00 |
% |
|
|
6,423,000 |
|
|
|
6,931,639 |
|
|
Sycamore Walk - Series A |
|
Bakersfield, CA |
|
1/1/2033 |
|
|
5.25 |
% |
|
|
3,598,006 |
|
|
|
3,961,411 |
|
|
The Palms at Premier Park |
|
Columbia, SC |
|
1/1/2050 |
|
|
6.25 |
% |
|
|
19,044,617 |
|
|
|
21,239,408 |
|
|
The Village at Madera - Series A |
|
Madera, CA |
|
12/1/2033 |
|
|
5.00 |
% |
|
|
3,085,000 |
|
|
|
3,314,934 |
|
|
Tyler Park Townhomes |
|
Greenfield, CA |
|
1/1/2030 |
|
|
5.75 |
% |
|
|
5,903,368 |
|
|
|
6,634,441 |
|
|
Village at Avalon |
|
Albuquerque, NM |
|
1/1/2059 |
|
|
5.80 |
% |
|
|
16,400,000 |
|
|
|
17,808,802 |
|
|
Village at River's Edge |
|
Columbia, SC |
|
6/1/2033 |
|
|
6.00 |
% |
|
|
9,938,059 |
|
|
|
11,359,173 |
|
|
Vineyard Gardens - Series A |
|
Oxnard, CA |
|
1/1/2035 |
|
|
5.50 |
% |
|
|
3,995,000 |
|
|
|
4,529,351 |
|
|
Westside Village Market |
|
Shafter, CA |
|
1/1/2030 |
|
|
5.75 |
% |
|
|
3,857,839 |
|
|
|
4,341,275 |
|
|
Willow Run |
|
Columbia, SC |
|
12/1/2050 |
|
|
5.50 |
% |
|
|
12,879,000 |
|
|
|
14,415,571 |
|
|
Woodlynn Village |
|
Maplewood, MN |
|
11/1/2042 |
|
|
6.00 |
% |
|
|
4,221,000 |
|
|
|
4,255,155 |
|
|
Total Mortgage Revenue Bonds |
|
|
|
|
|
|
|
|
|
$ |
677,698,116 |
|
|
$ |
732,153,435 |
|
OTHER INVESTMENTS
DECEMBER 31, 2018
|
|
|
|
|
Weighted |
|
|
Weighted Avg. |
|
|
|
|
|
|
|
||||
|
Name |
|
|
|
Average Lives |
|
|
Coupon Rate |
|
|
Principal Outstanding |
|
|
Estimated Fair Value |
|
||||
|
|
|
|
|
|
|
|
|
|
|
|
|
|
|
|
|
|
|
|
|
Public Housing Capital Fund Trust Certificate I |
|
|
|
|
6.49 |
|
|
|
5.33 |
% |
|
$ |
24,913,137 |
|
|
$ |
24,894,527 |
|
|
Public Housing Capital Fund Trust Certificate II |
|
|
|
|
5.56 |
|
|
|
4.35 |
% |
|
|
9,536,832 |
|
|
|
9,116,553 |
|
|
Public Housing Capital Fund Trust Certificate III |
|
|
|
|
6.76 |
|
|
|
5.30 |
% |
|
|
15,199,430 |
|
|
|
14,661,006 |
|
|
|
|
|
|
|
|
|
|
|
|
|
|
$ |
49,649,399 |
|
|
$ |
48,672,086 |
|
|
|
23 |