
Exhibit 99.1
Supplemental Financial Report for
Quarter Ended September 30, 2019
|
|
|
|
AMERICA FIRST MULTIFAMILY INVESTORS, L.P.
All statements in this document other than statements of historical facts, including statements regarding our future results of operations and financial position, business strategy and plans and objectives of management for future operations, are forward-looking statements. When used, statements which are not historical in nature, including those containing words such as “anticipate,” “estimate,” “should,” “expect,” “believe,” “intend,” and similar expressions, are intended to identify forward-looking statements. We have based forward-looking statements largely on our current expectations and projections about future events and financial trends that we believe may affect our business, financial condition and results of operations. This document may also contain estimates and other statistical data made by independent parties and by us relating to market size and growth and other industry data. This data involves a number of assumptions and limitations, and you are cautioned not to give undue weight to such estimates. We have not independently verified the statistical and other industry data generated by independent parties contained in this supplement and, accordingly, we cannot guarantee their accuracy or completeness. In addition, projections, assumptions and estimates of our future performance and the future performance of the industries in which we operate are necessarily subject to a high degree of uncertainty and risk due to a variety of factors, including those described under the headings “Item 1A Risk Factors” in our 2018 Annual Report on Form 10-K for the year ended December 31, 2018. These forward-looking statements are subject to various risks and uncertainties and America First Multifamily Investors, L.P. expressly disclaims any obligation to publicly update or revise any forward-looking statements, whether as a result of new information, future events or otherwise.
Most, but not all, of the selected financial information furnished herein is derived from the America First Multifamily Investors, L.P.’s (“ATAX” or “Partnership”) consolidated financial statements and related notes prepared in accordance with GAAP and management’s discussion and analysis of financial condition and results of operations included in the Partnership’s reports on Forms 10-K and 10-Q. The Partnership’s annual consolidated financial statements were subject to an independent audit, dated February 28, 2019.
Disclosure Regarding Non-GAAP Measures
This document refers to certain financial measures that are identified as non-GAAP. We believe these non-GAAP measures are helpful to investors because they are the key information used by management to analyze our operations. This supplemental information should not be considered in isolation or as a substitute for the related GAAP measures.
Please see the consolidated financial statements we filed with the Securities and Exchange Commission on Forms 10-K and 10-Q. Our GAAP consolidated financial statements can be located upon searching for the Partnership’s filings at www.sec.gov.
|
|
|
|
|
|
|
PARTNERSHIP FINANCIAL INFORMATION
TABLE OF CONTENTS
|
|
Pages |
|
|
|
Supplemental Letter from the CEO |
4 |
|
|
Quarterly Fact Sheet |
5 |
|
|
Financial Performance Trend Graphs |
6-11 |
|
|
Other Partnership Information |
12 |
|
|
Partnership Financial Measures |
13 |
|
|
|
|
|
|
|
|
|
|
|
AMERICA FIRST MULTIFAMILY INVESTORS L.P.
SUPPLEMENTAL LETTER FROM THE CEO
During Q3 2019, ATAX continued to focus its efforts to “fine tune” the Balance Sheet. The results are as follows:
As of and for the three months ended September 30, 2019:
|
|
• |
Total revenues of $14.9 million, |
|
|
• |
Net income, basic and diluted, of $0.13 per Beneficial Unit Certificate (“BUC”), |
|
|
• |
Cash Available for Distribution of $0.21 per BUC, |
|
|
• |
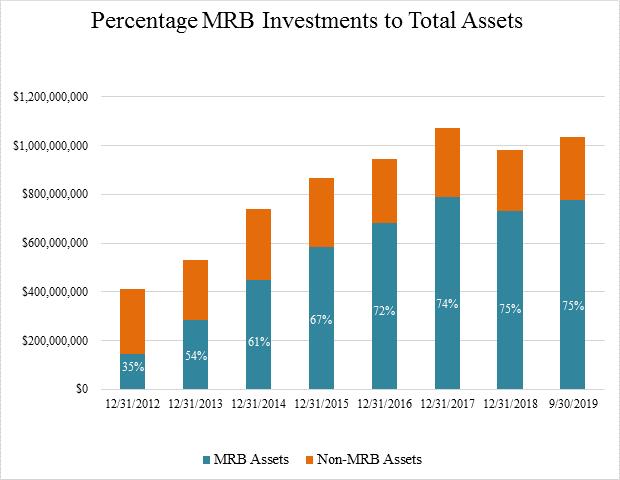
Total assets of $1.0 billion, and |
|
|
• |
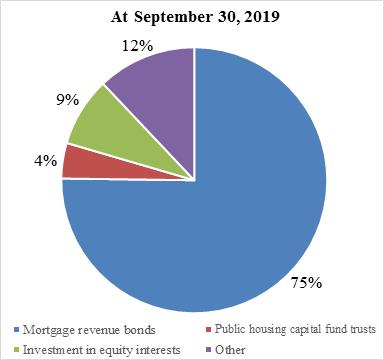
Total Mortgage Revenue Bond (“MRB”) investments of $777.3 million. |
For the nine months ended September 30, 2019:
|
|
• |
Total revenues of $46.9 million, |
|
|
• |
Net income, basic and diluted, of $0.26 per BUC, and |
|
|
• |
Cash Available for Distribution of $0.39 per BUC. |
The Partnership reported the following notable transactions during the third quarter of 2019:
|
|
• |
Increased its Investment in unconsolidated entities by approximately $1.0 million, |
|
|
• |
Net repayment on unsecured lines of credit of $10.0 million, |
|
|
• |
Repayment of Tender Option Bond (“TOB”) Trust financings and Term TOB Trust financings of approximately |
$71.7 million, and
|
|
• |
Repayment of Term A/B Trust financings of approximately $10.5 million. |
In July 2019, we refinanced the M24 and M33 TEBS financings with Freddie Mac, converted each to a fixed interest rate and extended their maturities to May 2027 and September 2030, respectively.
In September 2019, the membership interests of Vantage at Panama City Beach were sold to an unrelated third party. The Partnership received cash of approximately $22.7 million upon sale. The Partnership recognized approximately $547,000 of investment income and approximately $10.5 million of gain on sale of investment in an unconsolidated entity associated with the sale.
Thank you for your continued support of ATAX!

Chad Daffer
Chief Executive Officer
|
|
4 |
|
|
|
|
|
PARTNERSHIP DETAILS |
|
ATAX was formed for the primary purpose of acquiring a portfolio of MRBs that are issued to provide construction and/or permanent financing of multifamily residential properties. We continue to expect most of the interest paid on these MRBs to be excludable from gross income for federal income tax purposes. We continue to pursue a business strategy of acquiring additional MRBs and other investments on a leveraged basis. We also invest in other securities which, if not secured by a direct or indirect interest in a multifamily property, must be rated in one of the four highest rating categories by at least one nationally recognized securities rating agency. We have also acquired interests in multifamily projects (“MF Properties”) to position ourselves for future investments in MRBs issued to finance these properties. In addition, we have invested in equity interests in multifamily, market rate projects throughout the U.S.
|
|||||||||
|
(As of September 30, 2019) |
|
||||||||||
|
|
|
||||||||||
|
Symbol (NASDAQ) |
|
|
ATAX |
|
|||||||
|
Annual Distribution |
|
$ |
0.50 |
|
|||||||
|
Price |
|
$ |
8.18 |
|
|||||||
|
Yield |
|
|
6.1% |
|
|||||||
|
|
|
|
|
|
|||||||
|
BUCs Outstanding (including Restricted Units) |
|
|
60,835,204 |
|
|||||||
|
Market Capitalization |
|
$ |
497,631,969 |
|
|||||||
|
52-week BUC price range |
|
$5.20 to $8.18 |
|
||||||||
|
|
|
|
|
|
|||||||
|
|
|
|
|
|
|||||||
|
Partnership Financial Information for Q3 2019 ($’s in 000’s, except per BUC amounts) |
|
||||||||||
|
|
9/30/2019 |
|
12/31/2018 |
|
|||||||
|
|
|
|
|
|
|||||||
|
Total Assets |
$1,033,501 |
|
$982,713 |
|
|||||||
|
Leverage Ratio1 |
61% |
|
60% |
|
|||||||
|
|
|
|
|
|
|||||||
|
|
Q3 2019 |
|
YTD 2019 |
|
|||||||
|
|
|
|
|
|
|||||||
|
Total Revenue |
$14,866 |
|
$46,877 |
|
|||||||
|
Net Income |
$9,708 |
|
$20,046 |
|
|||||||
|
Cash Available for Distribution (“CAD”)2 |
$12,516 |
|
$23,701 |
|
|||||||
|
Distribution Declared per BUC3 |
$0.125 |
|
$0.375 |
|
|||||||
|
|
|
|
|
|
|||||||
|
1 |
Our overall leverage ratio is calculated as total outstanding debt divided by total assets using cost adjusted for paydowns for MRBs, PHC Certificates, property loans, and taxable MRBs, and initial cost for deferred financing costs and MF Properties. |
|
2 |
Management utilizes a calculation of Cash Available for Distribution (“CAD”) to assess the Partnership’s operating performance. This is a non-GAAP financial measure and a reconciliation of our GAAP net income to CAD is provided on page 13 of the Supplement herein. |
|
3 |
The most recent distribution was paid on October 31, 2019 for BUC holders of record as of September 30, 2019. The distribution is payable to BUC holders of record as of the last business day of the quarter end and ATAX trades ex-dividend two days prior to the record date, with a payable date of the last business day of the subsequent month. |
|
|
5 |
|
|
|
|

|
|
6 |
|
|
|
|
ATAX MORTGAGE REVENUE BOND PROFILE
|
|
7 |
|
|
|
|
|
|
8 |
|
|
|
|
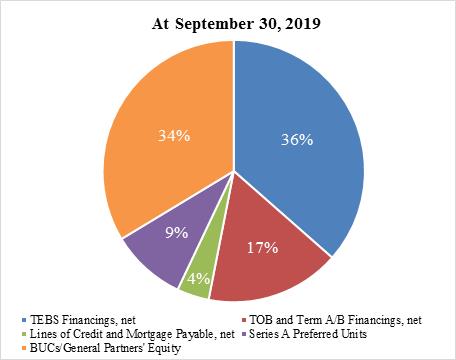
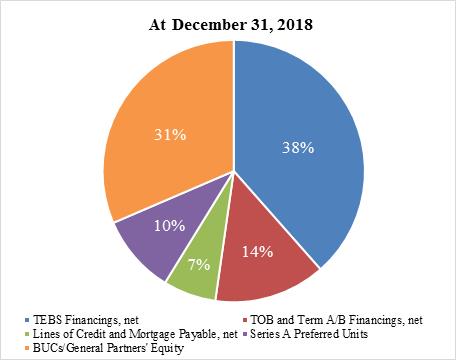
DEBT FINANCING, NET ($’s in 000’s)
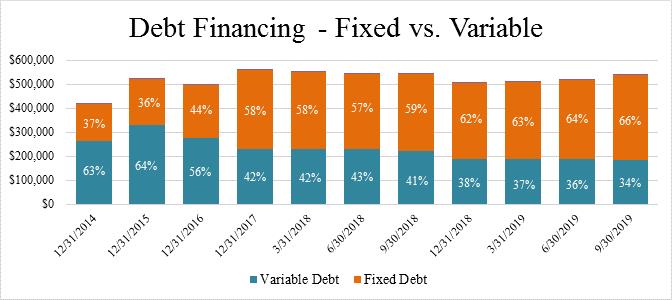
INTEREST RATE SENSITIVITY ANALYSIS1
|
Description |
|
- 25 basis points |
|
+ 50 basis points |
|
+ 100 basis points |
|
+ 150 basis points |
|
+ 200 basis points |
|
TOB & Term A/B Debt Financings |
|
$152,728 |
|
$(276,955) |
|
$(549,141) |
|
$(826,363) |
|
$(1,104,523) |
|
TEBS Debt Financings |
|
114,212 |
|
(207,204) |
|
(304,896) |
|
(346,539) |
|
(388,804) |
|
Other Investment Financings |
|
24,987 |
|
(49,947) |
|
(99,859) |
|
(149,734) |
|
(199,573) |
|
Total |
|
$291,927 |
|
$(534,106) |
|
$(953,896) |
|
$(1,322,636) |
|
$(1,692,900) |
|
|
1 |
Represents the change over the next 12 months assuming an immediate shift in rates and management does not adjust its strategy in response. |
|
|
9 |
|
|
|
|
|
|
10 |
|
|
|
|
|
|
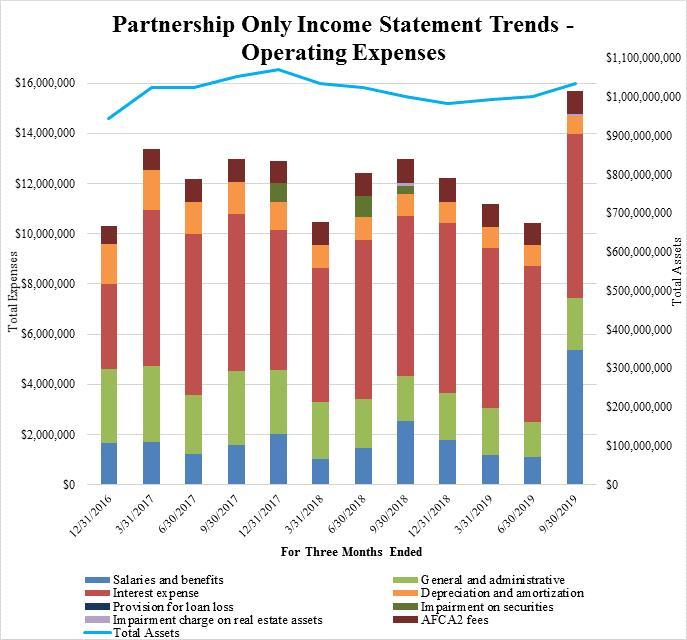
• |
Since October 1, 2017, the ratio of “Salaries and benefits” and “General and administrative” expenses has averaged approximately 0.40% of Total Assets on a quarterly basis. |
|
|
• |
Salaries and benefits expense for the three months ended September 30, 2019 includes approximately $2.7 million of expense related to the accelerated vesting of restricted units upon the change in control of ATAX’s general partner on September 10, 2019. |
|
|
11 |
|
|
|
|
|
OTHER PARTNERSHIP INFORMATION |
|||||
|
|
|
|
|
||
|
Corporate Office: |
|
|
Transfer Agent:
|
||
|
1004 Farnam Street |
|
|
American Stock Transfer & Trust Company |
||
|
Suite 400 |
|
|
59 Maiden Lane |
||
|
Omaha, NE 68102 |
|
|
Plaza Level |
||
|
Phone: |
402-444-1630 |
|
New York, NY 10038 |
||
|
Investor & K-1 Services: |
855-4AT-AXK1 |
|
|
Phone: 718-921-8124 |
|
|
Web Site: |
www.ataxfund.com |
|
|
888-991-9902 |
|
|
K-1 Services Email: |
k1s@ataxfund.com |
|
|
|
|
|
Ticker Symbol: |
ATAX |
|
|
|
|
|
Corporate Counsel: |
|
Independent Accountants: |
|
Barnes & Thornburg LLP |
|
PwC |
|
11 S. Meridian Street |
|
1 North Wacker Drive |
|
Indianapolis, IN 46204 |
|
Chicago, Illinois 60606 |
|
|
|
|
|
Board of Managers of Greystone AF Manager, LLC: |
||
|
(acting as the directors of ATAX) |
||
|
|
|
|
|
Stephen Rosenberg |
|
Chairman of the Board |
|
Curtis A. Pollock |
|
Manager |
|
Jeffrey M. Baevsky |
|
Manager |
|
Drew C. Fletcher |
|
Manager |
|
Steven C. Lilly |
|
Manager |
|
Walter K. Griffith |
|
Manager |
|
William P. Mando, Jr. |
|
Manager |
|
|
|
|
|
Corporate Officers: |
||
|
Chief Executive Officer – Chad L. Daffer |
||
|
Chief Financial Officer – Craig S. Allen |
||
|
Chief Investment Officer - Kenneth C. Rogozinski |
||
|
|
12 |
|
|
|
|
AMERICA FIRST MULTIFAMILY INVESTORS, L.P.
CASH AVAILABLE FOR DISTRIBUTION (CAD) AND OTHER PERFORMANCE MEASURES
The following table contains reconciliations of the Partnership’s GAAP net income to its CAD:
|
|
For the Three |
|
|
For the Nine |
|
||
|
|
Months Ended |
|
|
Months Ended |
|
||
|
|
September 30, 2019 |
|
|
September 30, 2019 |
|
||
|
Partnership net income |
$ |
9,707,903 |
|
|
$ |
20,045,906 |
|
|
Change in fair value of derivatives and interest rate derivative amortization |
|
68,333 |
|
|
|
458,141 |
|
|
Depreciation and amortization expense |
|
743,503 |
|
|
|
2,384,115 |
|
|
Impairment charge on real estate assets |
|
75,000 |
|
|
|
75,000 |
|
|
Amortization of deferred financing costs |
|
745,457 |
|
|
|
1,476,463 |
|
|
Restricted units compensation expense |
|
3,265,677 |
|
|
|
3,636,091 |
|
|
Deferred income taxes |
|
(82,167 |
) |
|
|
(138,331 |
) |
|
Redeemable Series A Preferred Unit distribution and accretion |
|
(717,762 |
) |
|
|
(2,153,288 |
) |
|
Tier 2 Income distributable to the General Partner |
|
(1,264,949 |
) |
|
|
(2,017,974 |
) |
|
Bond purchase premium (discount) amortization (accretion), net of cash received |
|
(24,532 |
) |
|
|
(64,970 |
) |
|
Total CAD |
$ |
12,516,463 |
|
|
$ |
23,701,153 |
|
|
|
|
|
|
|
|
|
|
|
Weighted average number of BUCs outstanding, basic |
|
60,519,542 |
|
|
|
60,457,299 |
|
|
|
|
|
|
|
|
|
|
|
Partnership Only: |
|
|
|
|
|
|
|
|
Net income per BUC, basic |
$ |
0.13 |
|
|
$ |
0.26 |
|
|
Total CAD per BUC, basic |
$ |
0.21 |
|
|
$ |
0.39 |
|
|
Distributions declared per BUC |
$ |
0.125 |
|
|
$ |
0.375 |
|
|
|
13 |