Exhibit 99.1
Supplemental Financial Report for the
Quarter Ended September 30, 2021
|
|
|
|
AMERICA FIRST MULTIFAMILY INVESTORS, L.P.
All statements in this document other than statements of historical facts, including statements regarding our future results of operations and financial position, business strategy and plans and objectives of management for future operations, are forward-looking statements. When used, statements which are not historical in nature, including those containing words such as “anticipate,” “estimate,” “should,” “expect,” “believe,” “intend,” and similar expressions, are intended to identify forward-looking statements. We have based forward-looking statements largely on our current expectations and projections about future events and financial trends that we believe may affect our business, financial condition and results of operations. This document may also contain estimates and other statistical data made by independent parties and by us relating to market size and growth and other industry data. This data involves a number of assumptions and limitations, and you are cautioned not to give undue weight to such estimates. We have not independently verified the statistical and other industry data generated by independent parties contained in this supplement and, accordingly, we cannot guarantee their accuracy or completeness. In addition, projections, assumptions and estimates of our future performance and the future performance of the industries in which we operate are necessarily subject to a high degree of uncertainty and risk due to a variety of factors, including those described under the headings “Item 1A Risk Factors” in our 2020 Annual Report on Form 10-K for the year ended December 31, 2020. These forward-looking statements are subject to various risks and uncertainties and America First Multifamily Investors, L.P. (“ATAX” or “Partnership”) expressly disclaims any obligation to publicly update or revise any forward-looking statements, whether as a result of new information, future events or otherwise.
Most, but not all, of the selected financial information furnished herein is derived from the America First Multifamily Investors, L.P.’s consolidated financial statements and related notes prepared in conformity with generally accepted accounting principles in the United States of America (“GAAP”) and management’s discussion and analysis of financial condition and results of operations included in the Partnership’s reports on Forms 10-K and 10-Q. The Partnership’s annual consolidated financial statements were subject to an independent audit, dated February 25, 2021.
Disclosure Regarding Non-GAAP Measures
This document refers to certain financial measures that are identified as non-GAAP. We believe these non-GAAP measures are helpful to investors because they are the key information used by management to analyze our operations. This supplemental information should not be considered in isolation or as a substitute for the related GAAP measures.
Please see the consolidated financial statements we filed with the Securities and Exchange Commission on Forms 10-K and 10-Q. Our GAAP consolidated financial statements can be located upon searching for the Partnership’s filings at www.sec.gov.
|
|
|
|
|
|
|
PARTNERSHIP FINANCIAL INFORMATION
TABLE OF CONTENTS
|
|
Pages |
|
|
|
Letter from the CEO |
4 |
|
|
Quarterly Fact Sheet |
6 |
|
|
Financial Performance Trend Graphs |
7-12 |
|
|
Other Partnership Information |
13 |
|
|
Partnership Financial Measures |
14-15 |
|
|
|
|
|
|
|
|
|
|
|
AMERICA FIRST MULTIFAMILY INVESTORS, L.P.
LETTER FROM THE CEO
I am very pleased with the operating results for our third quarter, as we continued to execute on our construction lending commitments and realized another gain on the redemption of one of our Vantage investments.
We reported the following financial results as of and for the three months ended September 30, 2021:
|
|
• |
Total revenues of $17.7 million |
|
|
• |
Net income, basic and diluted, of $0.19 per Beneficial Unit Certificate (“BUC”) |
|
|
• |
Cash Available for Distribution (“CAD”) of $0.22 per BUC |
|
|
• |
Total assets of $1.3 billion |
|
|
• |
Total Mortgage Revenue Bond (“MRB”) and Governmental Issuer Loan (“GIL”) investments of $909.6 million |
We reported the following notable transactions during the third quarter of 2021:
|
|
• |
Completed a public offering of 5,462,500 BUCs for net proceeds of $31.2 million after payment of underwriting discounts, commissions and direct expenses. |
|
|
• |
Extended the maturity of the Partnership’s $50 million acquisition line of credit with Bankers Trust Company to June 2023 and converted to a secured facility. |
|
|
• |
Received proceeds from the sale of Vantage at Bulverde in Texas totaling $18.9 million on the Partnership’s initial investment commitment of $8.6 million in March 2018. |
|
|
• |
Redemptions of four MRBs with total principal of $32.4 million. Two of the MRBs were redeemed at a premium totaling $1.8 million. |
|
|
• |
Advanced funds for six GIL investment commitments totaling $35.6 million and four related property investment commitments totaling $14.4 million. This includes GIL and property loan commitments for two new projects totaling $131.9 million closed in the third quarter. The commitments will provide construction financing for affordable multifamily properties in Florida and Georgia. The Partnership has funded $7.6 million of these commitments as of September 30, 2021. |
|
|
• |
Advanced funds for two MRB investment commitments totaling $4.0 million and one taxable MRB totaling $1.0 million. |
|
|
• |
Made equity investments in three unconsolidated entities totaling $6.1 million. |
We continue to see consistent operating results from our MRB investments associated with affordable multifamily properties, with all such MRBs being current on contractual principal and interest payments as of September 30, 2021 and having received no requests for forbearance to date.
Our investments in student housing properties – the Live 929 Apartments MRB, The 50/50 MF Property and the Suites on Paseo MF Property - have completed Fall 2021 lease-up. As of September 30, 2021, Live 929 Apartments is 95% occupied, The 50/50 MF Property is 88% occupied, and the Suites on Paseo MF Property is 97%. We have granted forbearance on principal repayments on the Live 929 Apartments MRB through the end of 2021. Both of our owned MF properties are meeting all direct mortgage and operating obligations with cash flows from operations.
|
|
4 |
|
|
|
|
The borrower on the Provision proton therapy center MRB filed for Chapter 11 bankruptcy in the fourth quarter of 2020 and we continue to assess forbearance and restructuring options along with the other senior bondholders.
We and our unitholders continue to benefit from our Vantage investments. We received proceeds from the sale of Vantage at Bulverde in Texas totaling $18.9 million on the Partnership’s initial investment commitment of $8.6 million. We continue to see good leasing activity at the six Vantage properties where construction is complete, with four of these properties having achieved over 90% physical occupancy and two over 85% physical occupancy by the end of September. We have not experienced any material supply chain or labor disruptions on the six Vantage properties under construction. As we have seen in the past, the Vantage group, as the managing member of each property-owning entity, will position a property for sale upon stabilization.
We completed a public offering of 5,462,500 BUCs for net proceeds of $31.2 million in September and we are focused on deploying this capital into accretive investments.
Affiliates of Greystone & Co. Inc. continues to assist in our growth by introducing new investment opportunities. An affiliate of Greystone has forward committed to purchase seven of our GIL investments to date. In addition, through October 2021, we have closed MRB commitments totaling $45.9 million related to projects referred by a Greystone affiliate, demonstrating Greystone’s continuing support for ATAX’s operations.
We will continue to strategically work with our strongest sponsors on new investment opportunities where traditional sources of capital may not currently be available and to develop new relationships, particularly with those sponsors that are existing clients of Greystone and its affiliates.
Thank you for your continued support of ATAX!
Kenneth C. Rogozinski
Chief Executive Officer
|
|
5 |
|
|
|
|
THIRD QUARTER 2021 FACT SHEET
|
PARTNERSHIP DETAILS |
|
ATAX was formed for the primary purpose of acquiring a portfolio of MRBs that are issued to provide construction and/or permanent financing of affordable multifamily residential and commercial properties. We also invest in GILs, which are similar to MRBs, to provide construction financing for affordable multifamily properties. We continue to expect most of the interest paid on the MRBs and GILs to be excludable from gross income for federal income tax purposes. In addition, we have invested in equity interests in multifamily, market rate properties throughout the U.S. We have also acquired interests in multifamily properties (“MF Properties”) to position ourselves for future investments in MRBs issued to finance these properties or to operate the MF Properties until their “highest and best use” can be determined. We continue to pursue a business strategy of acquiring additional MRBs and GILs on a leveraged basis, and other investments.
|
|||||||||
|
(As of September 30, 2021) |
|
||||||||||
|
|
|
||||||||||
|
Symbol (NASDAQ) |
|
|
ATAX |
|
|||||||
|
Most Recent Quarterly Distribution |
|
$ |
0.11 |
|
|||||||
|
Unit Price |
|
$ |
5.96 |
|
|||||||
|
|
|
|
|
|
|||||||
|
|
|
|
|
|
|||||||
|
BUCs Outstanding |
|
|
65,930,903 |
|
|||||||
|
Market Capitalization |
|
$ |
392,948,182 |
|
|||||||
|
52-week BUC price range |
|
$3.67 to $7.07 |
|
||||||||
|
|
|
|
|
|
|||||||
|
|
|
|
|
|
|||||||
|
Partnership Financial Information for Q3 2021 ($’s in 000’s, except per BUC amounts)
|
|
||||||||||
|
|
9/30/2021 |
|
12/31/2020 |
|
|||||||
|
|
|
|
|
|
|||||||
|
Total Assets |
$1,284,501,519 |
|
$1,175,248 |
|
|||||||
|
Leverage Ratio1 |
66% |
|
67% |
|
|||||||
|
|
|
|
|
|
|||||||
|
|
Q3 2021 |
|
YTD 2021 |
|
|||||||
|
|
|
|
|
|
|||||||
|
Total Revenue |
$17,682 |
|
$48,476 |
|
|||||||
|
Net Income |
$12,988 |
|
$30,246 |
|
|||||||
|
Cash Available for Distribution (“CAD”)2 |
$13,305 |
|
$30,311 |
|
|||||||
|
Distributions Declared per BUC3 |
$0.11 |
|
$0.31 |
|
|||||||
|
|
|
|
|
|
|||||||
|
1 |
Our overall leverage ratio is calculated as total outstanding debt divided by total assets using cost adjusted for paydowns and allowances for MRBs, Governmental Issuer Loans, property loans, taxable MRBs and taxable GILs, and initial cost for deferred financing costs and MF Properties. |
|
2 |
Management utilizes a calculation of Cash Available for Distribution (“CAD”) to assess the Partnership’s operating performance. This is a non-GAAP financial measure and a reconciliation of our GAAP net income (loss) to CAD is provided on page 14 of the Supplement herein. |
|
3 |
The most recent distribution was paid on October 29, 2021 for BUC holders of record as of September 30, 2021. The distribution is payable to BUC holders of record as of the last business day of the quarter end and ATAX trades ex-dividend one day prior to the record date, with a payable date of the last business day of the subsequent month. |
|
|
6 |
|
|
|
|
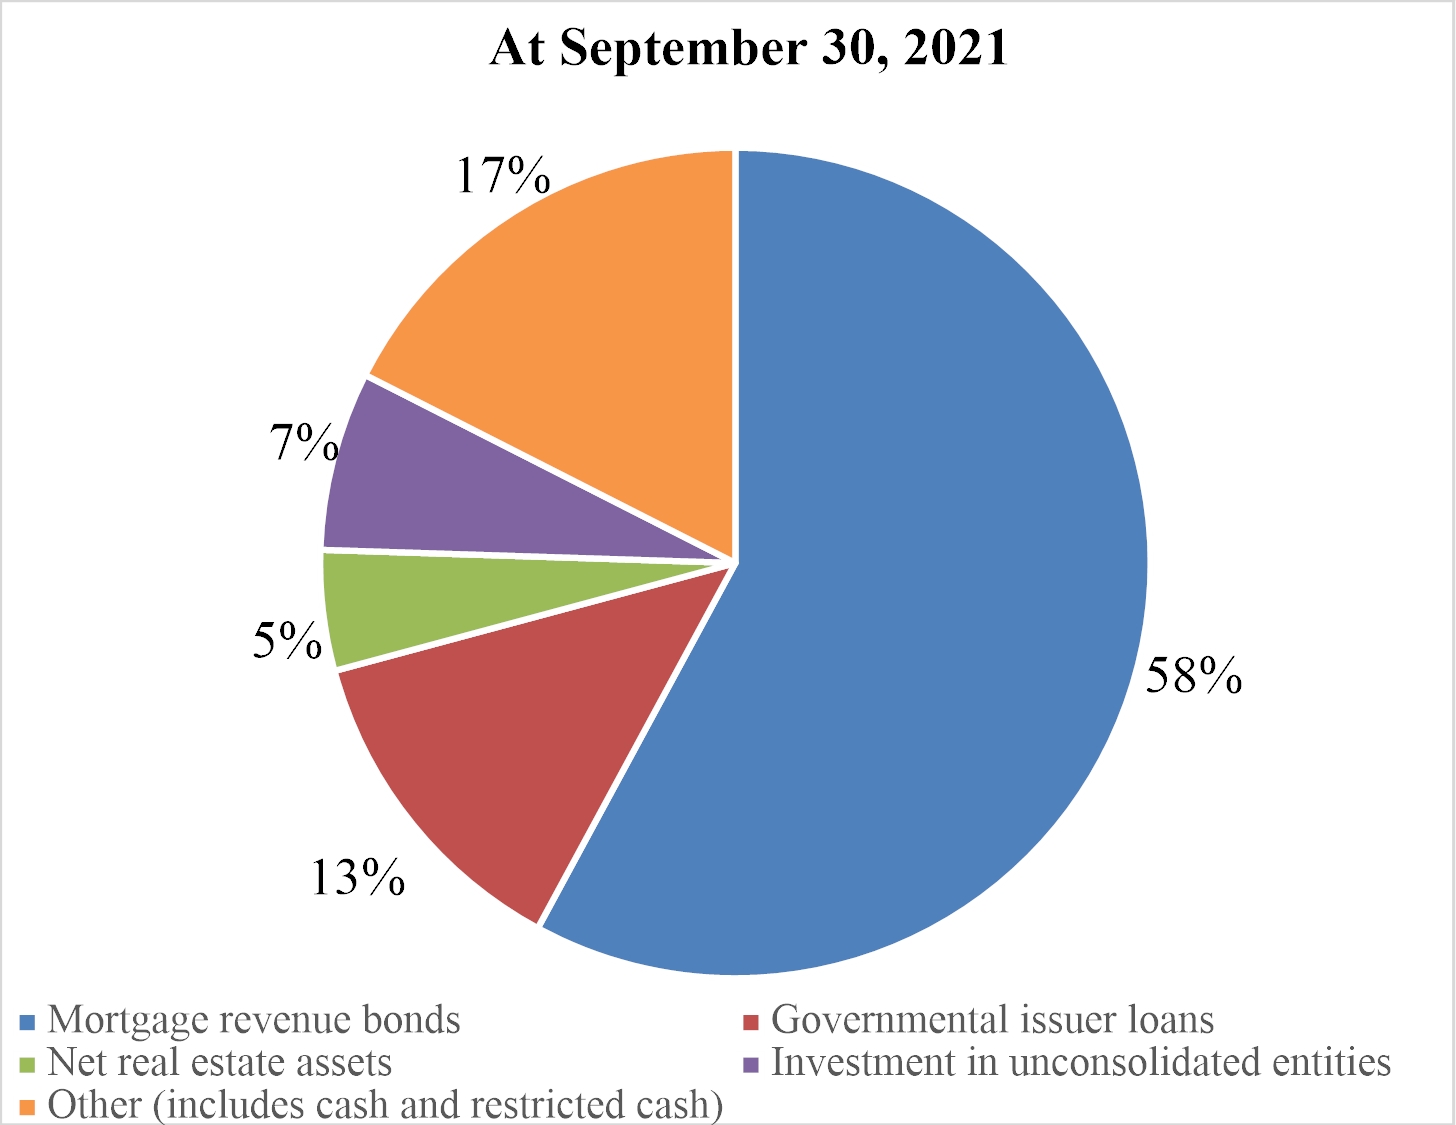
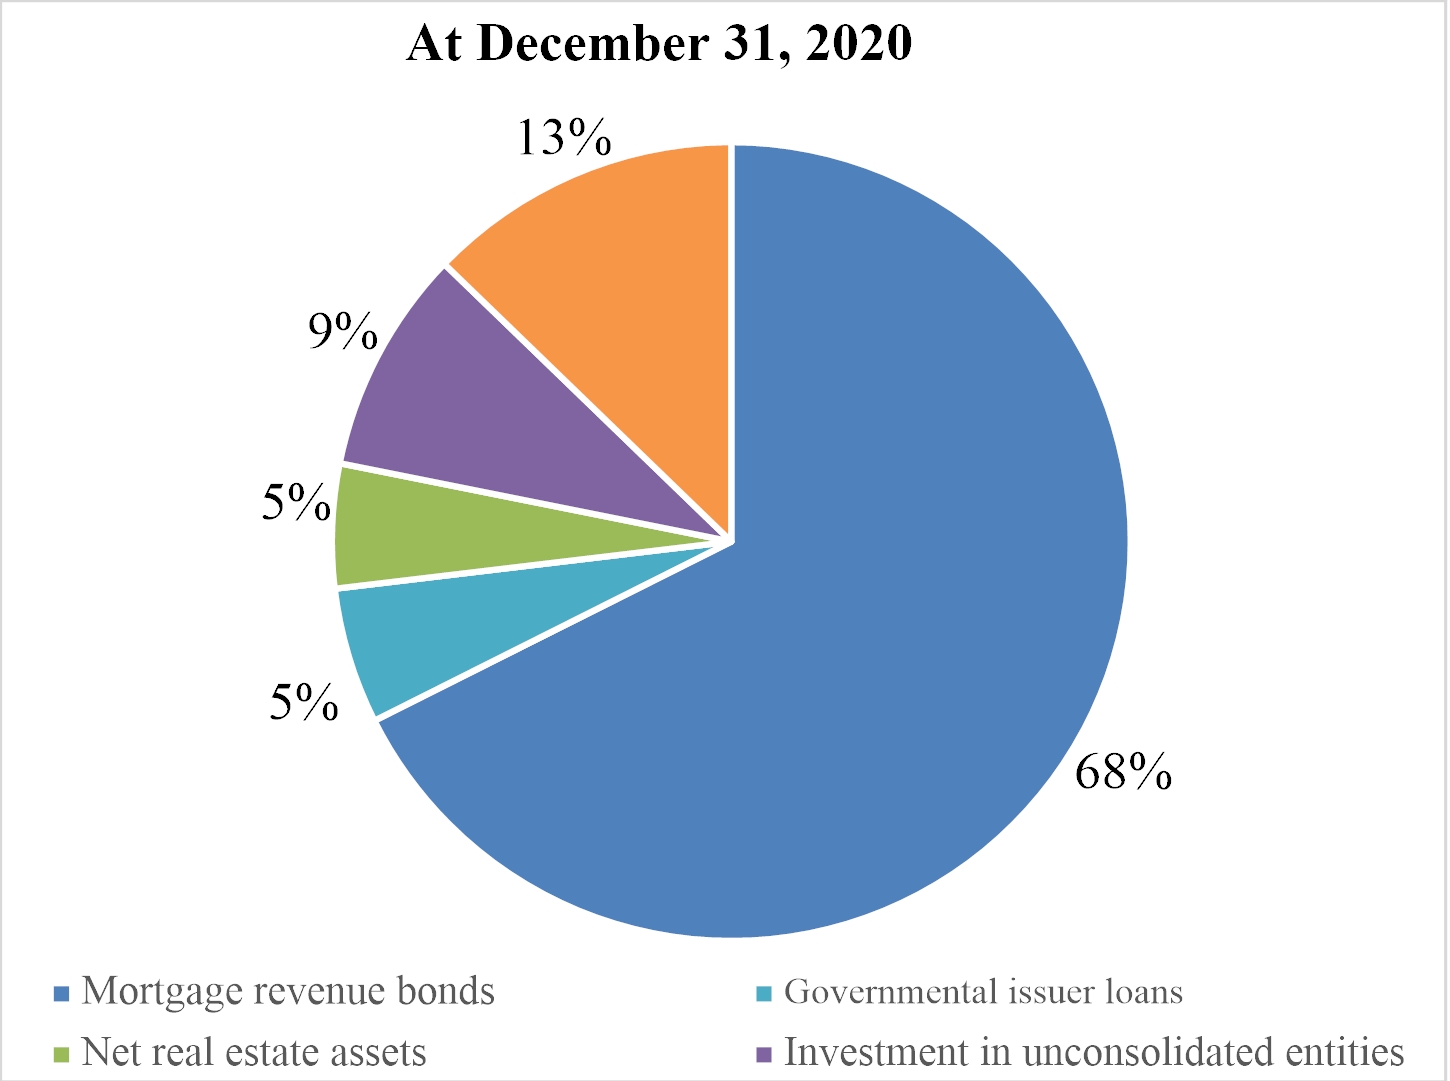
ATAX ASSET PROFILE
|
|
7 |
|
|
|
|
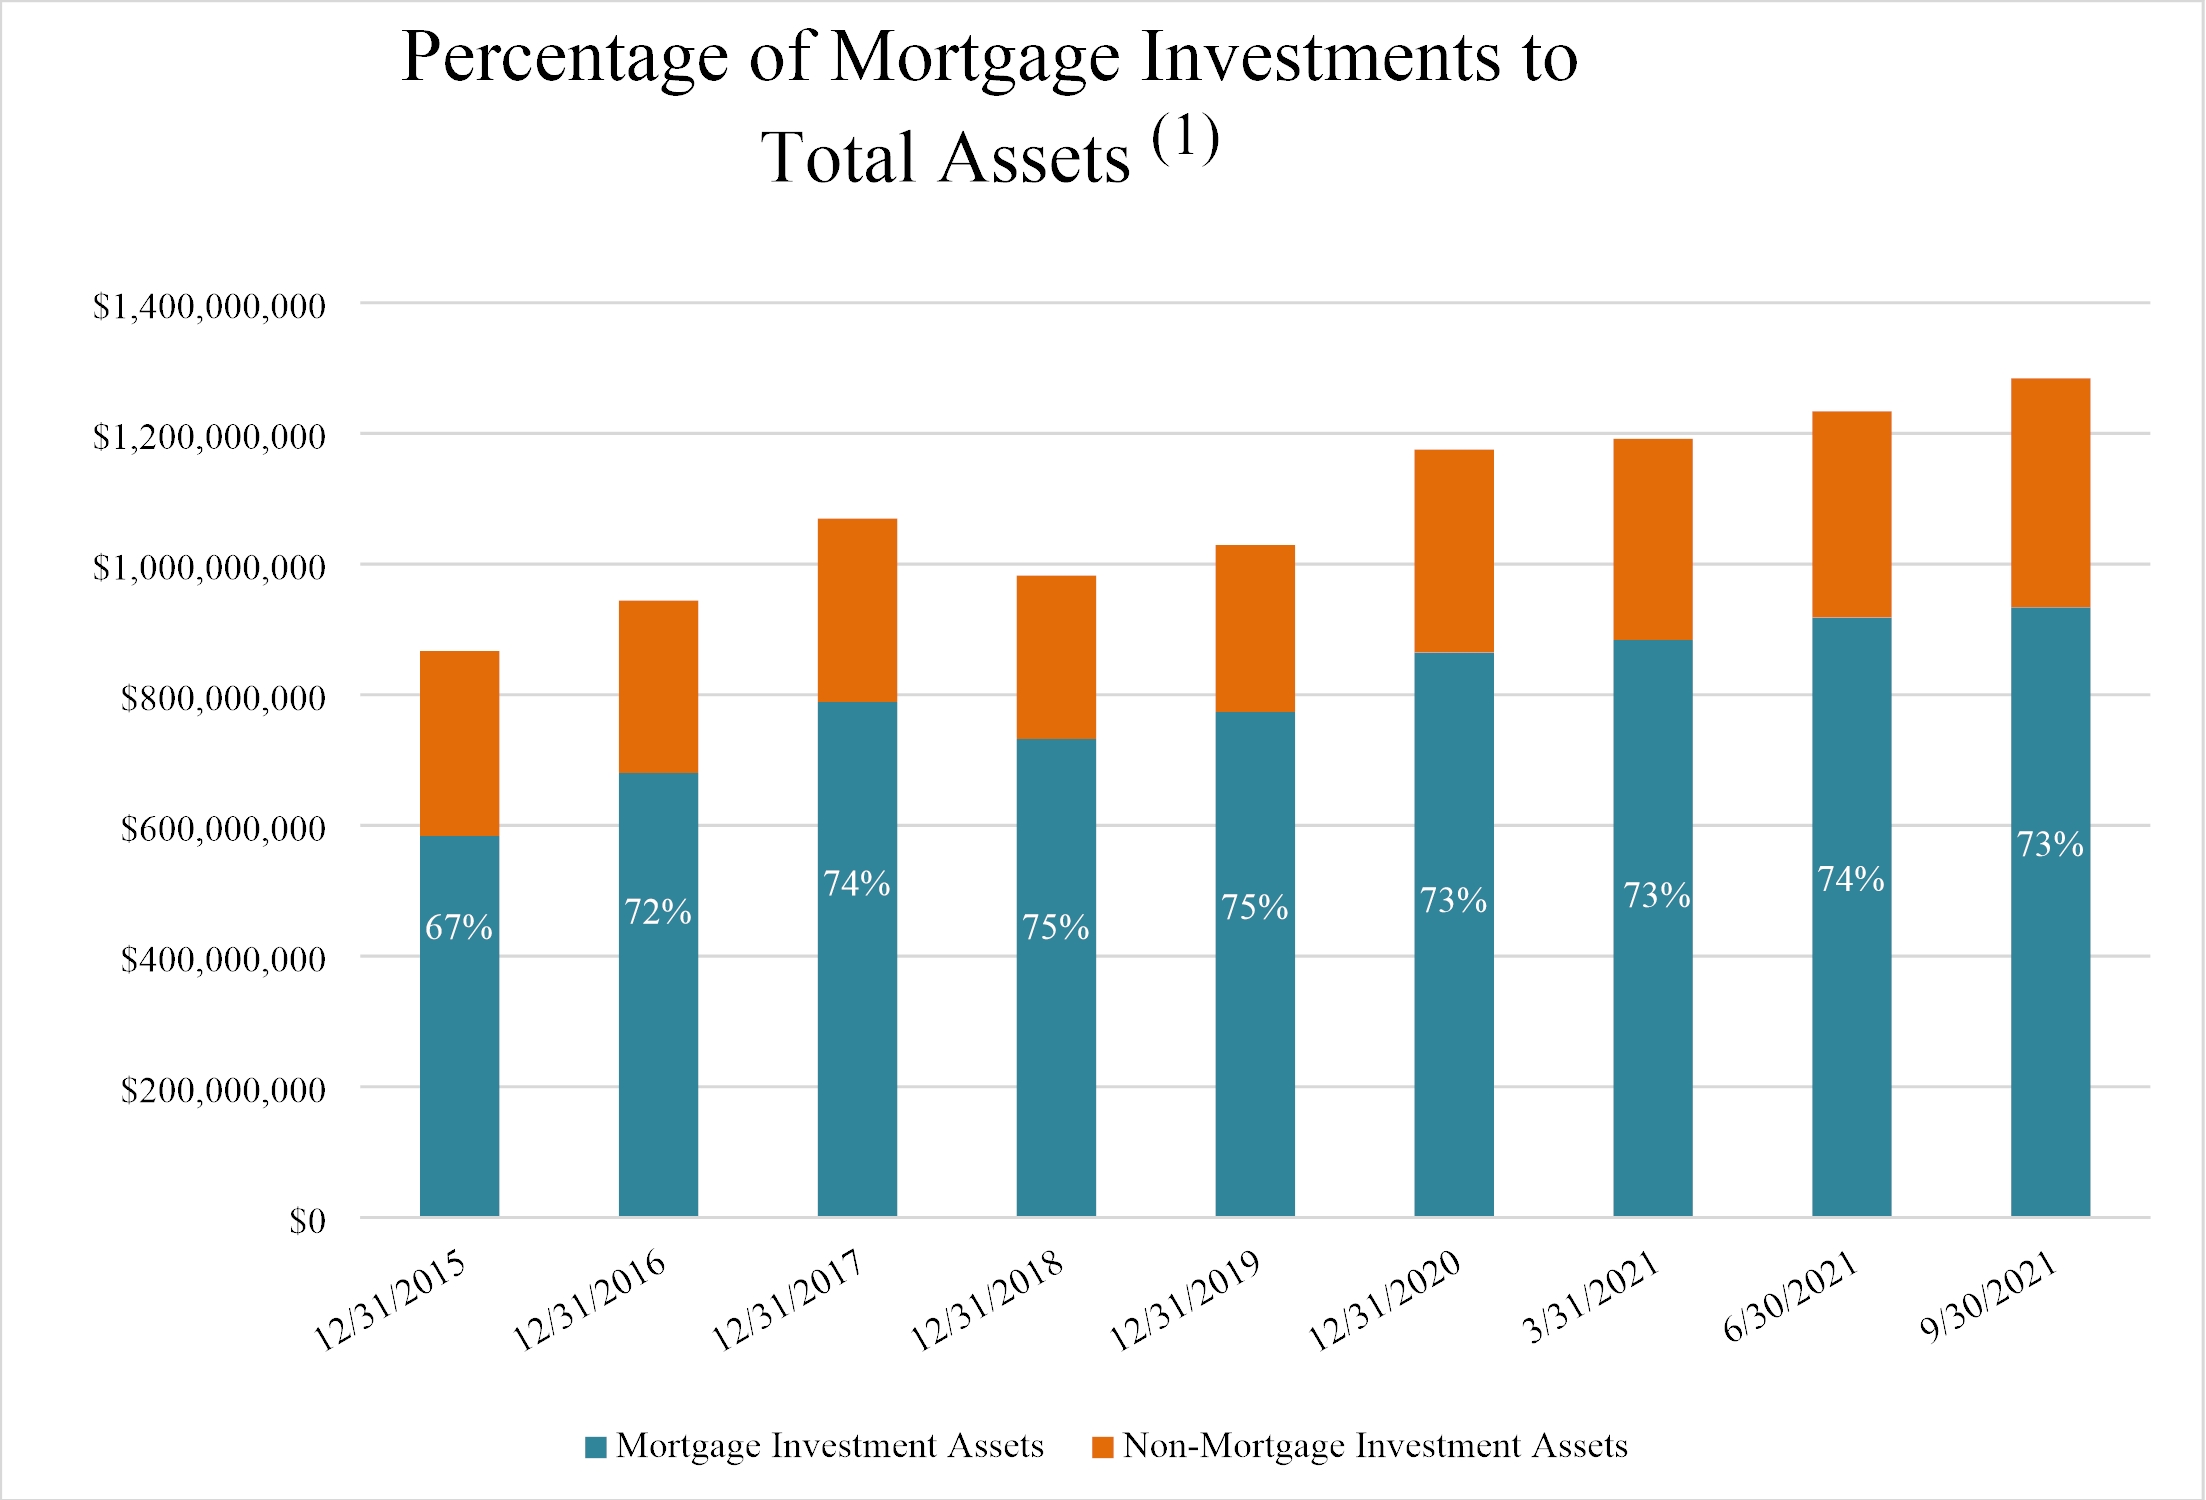
ATAX MORTGAGE INVESTMENT PROFILE
|
|
(1) |
Mortgage Investments include the Partnership’s Mortgage Revenue Bonds, Governmental Issuer Loans and Property Loans that share a first mortgage lien with the Governmental Issuer Loans. |
|
|
8 |
|
|
|
|
|
|
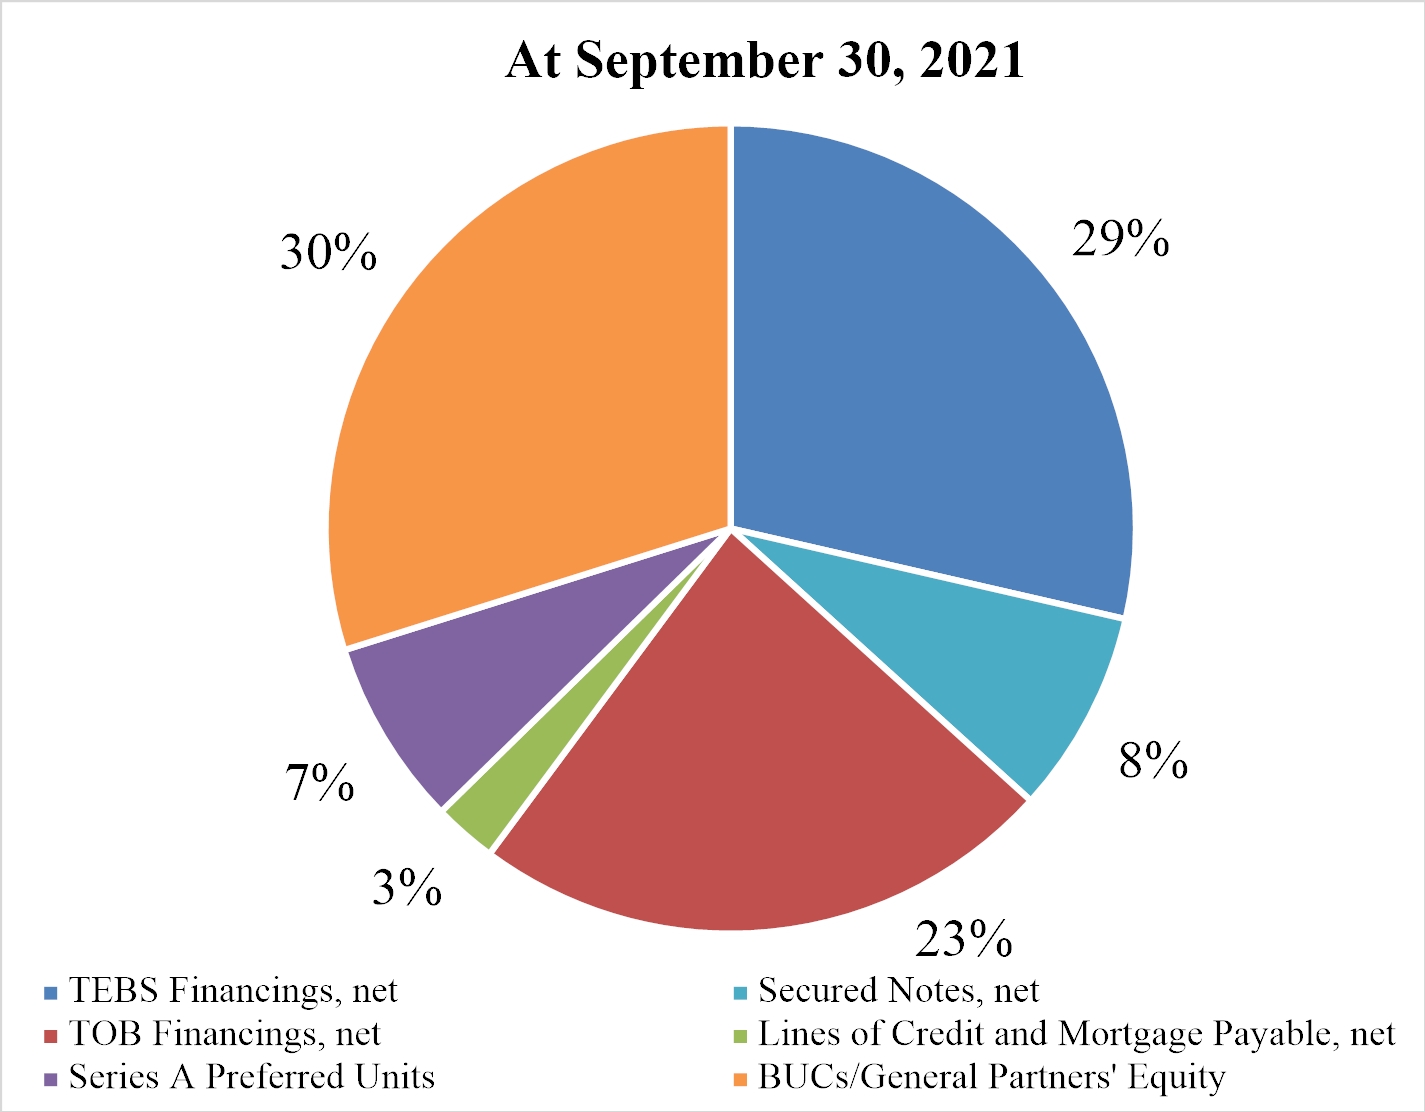
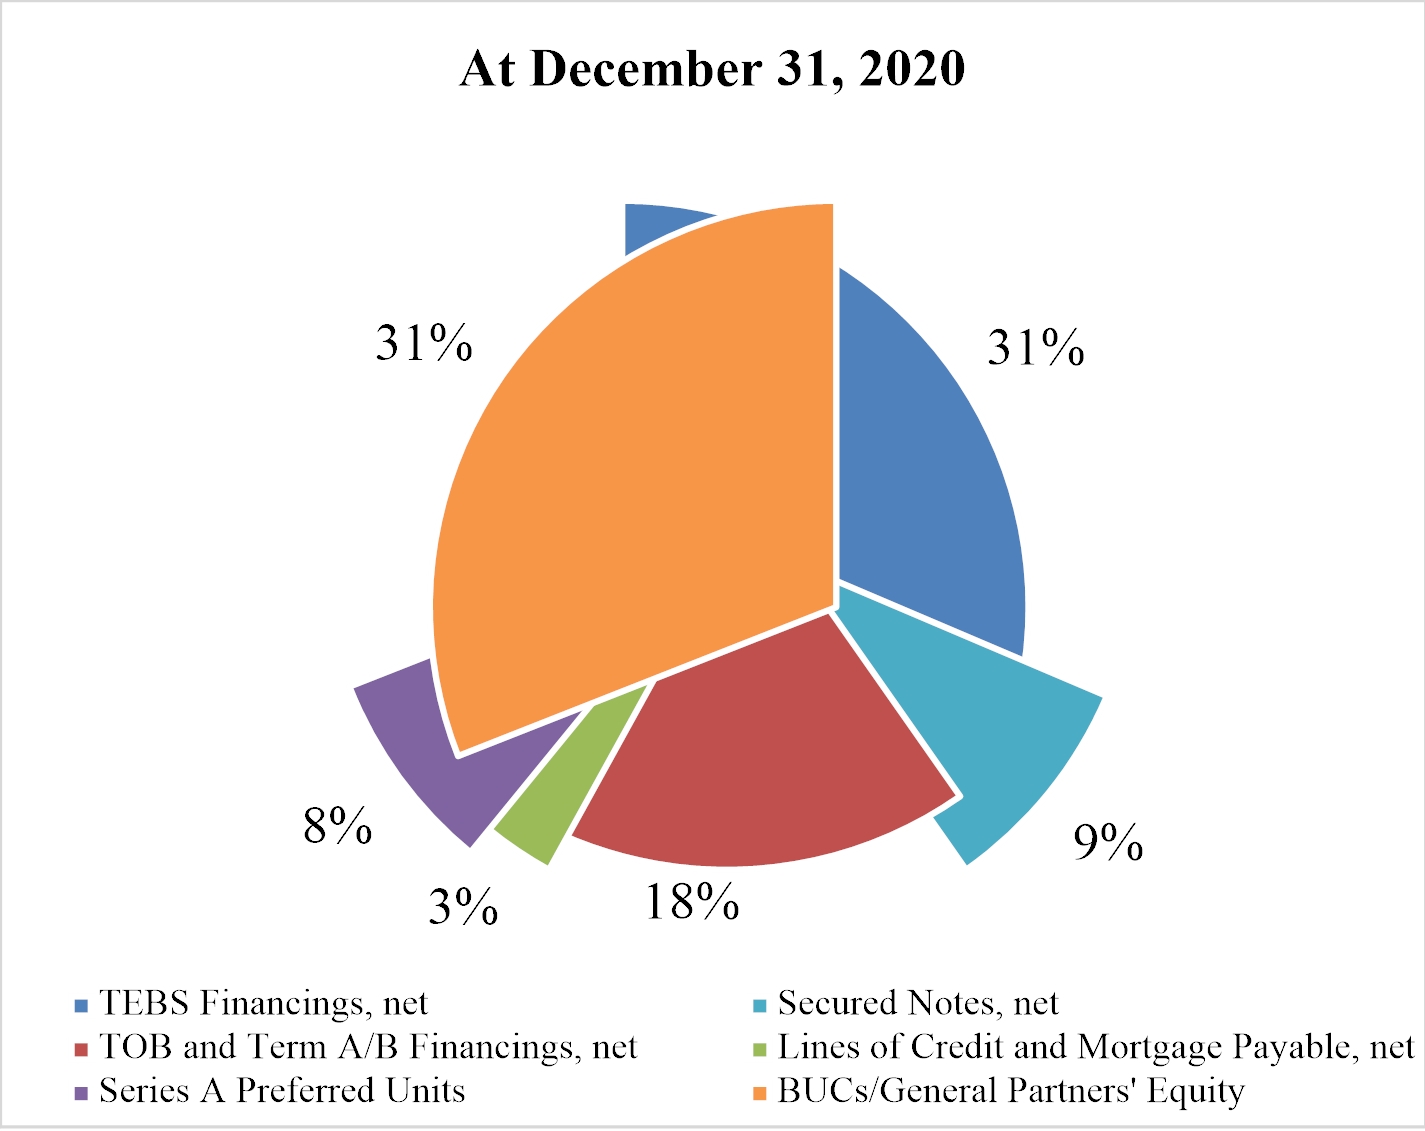
ATAX DEBT AND EQUITY PROFILE
|
|
9 |
|
|
|
|
DEBT FINANCING, NET ($’s in 000’s)
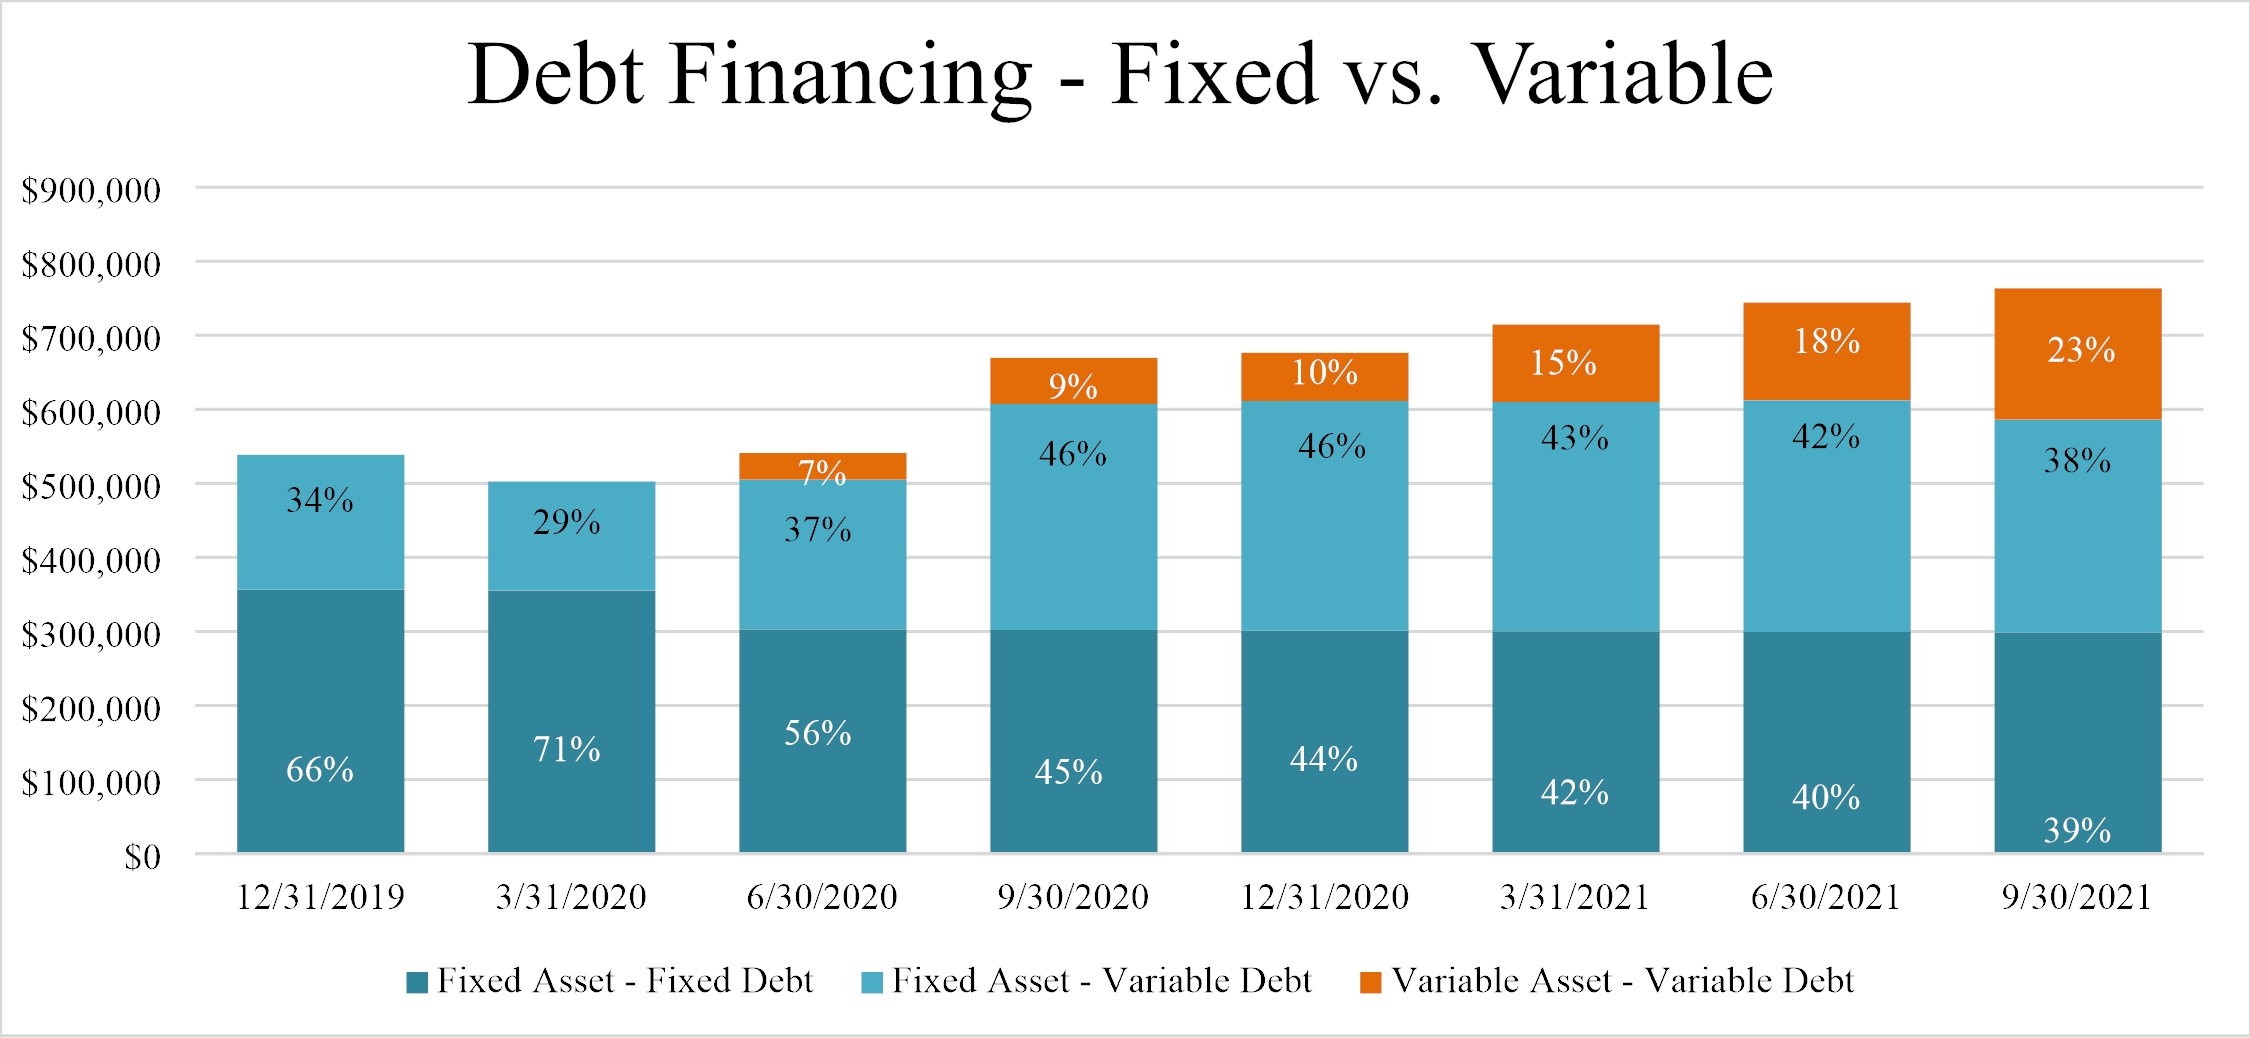
INTEREST RATE SENSITIVITY ANALYSIS (1)
|
Description |
|
- 25 basis points |
|
+ 50 basis points |
|
+ 100 basis points |
|
+ 150 basis points |
|
+ 200 basis points |
|
TOB Debt Financings |
|
$838,855 |
|
$(1,585,476) |
|
$(3,170,952) |
|
$(4,756,429) |
|
$(6,341,905) |
|
TEBS Debt Financings |
|
128,554 |
|
(257,107) |
|
(514,215) |
|
(771,322) |
|
(1,028,430) |
|
Other Investment Financings |
|
- |
|
(203,692) |
|
(753,692) |
|
(1,303,692) |
|
(1,853,692) |
|
Variable Rate Investments |
|
(109,354) |
|
456,062 |
|
1,547,401 |
|
2,826,714 |
|
4,165,350 |
|
Total |
|
$858,055 |
|
$(1,590,213) |
|
$(2,891,458) |
|
$(4,004,729) |
|
$(5,058,677) |
(1) Represents the change over the next 12 months assuming an immediate shift in rates and management does not adjust its strategy in response.
|
|
10 |
|
|
|
|
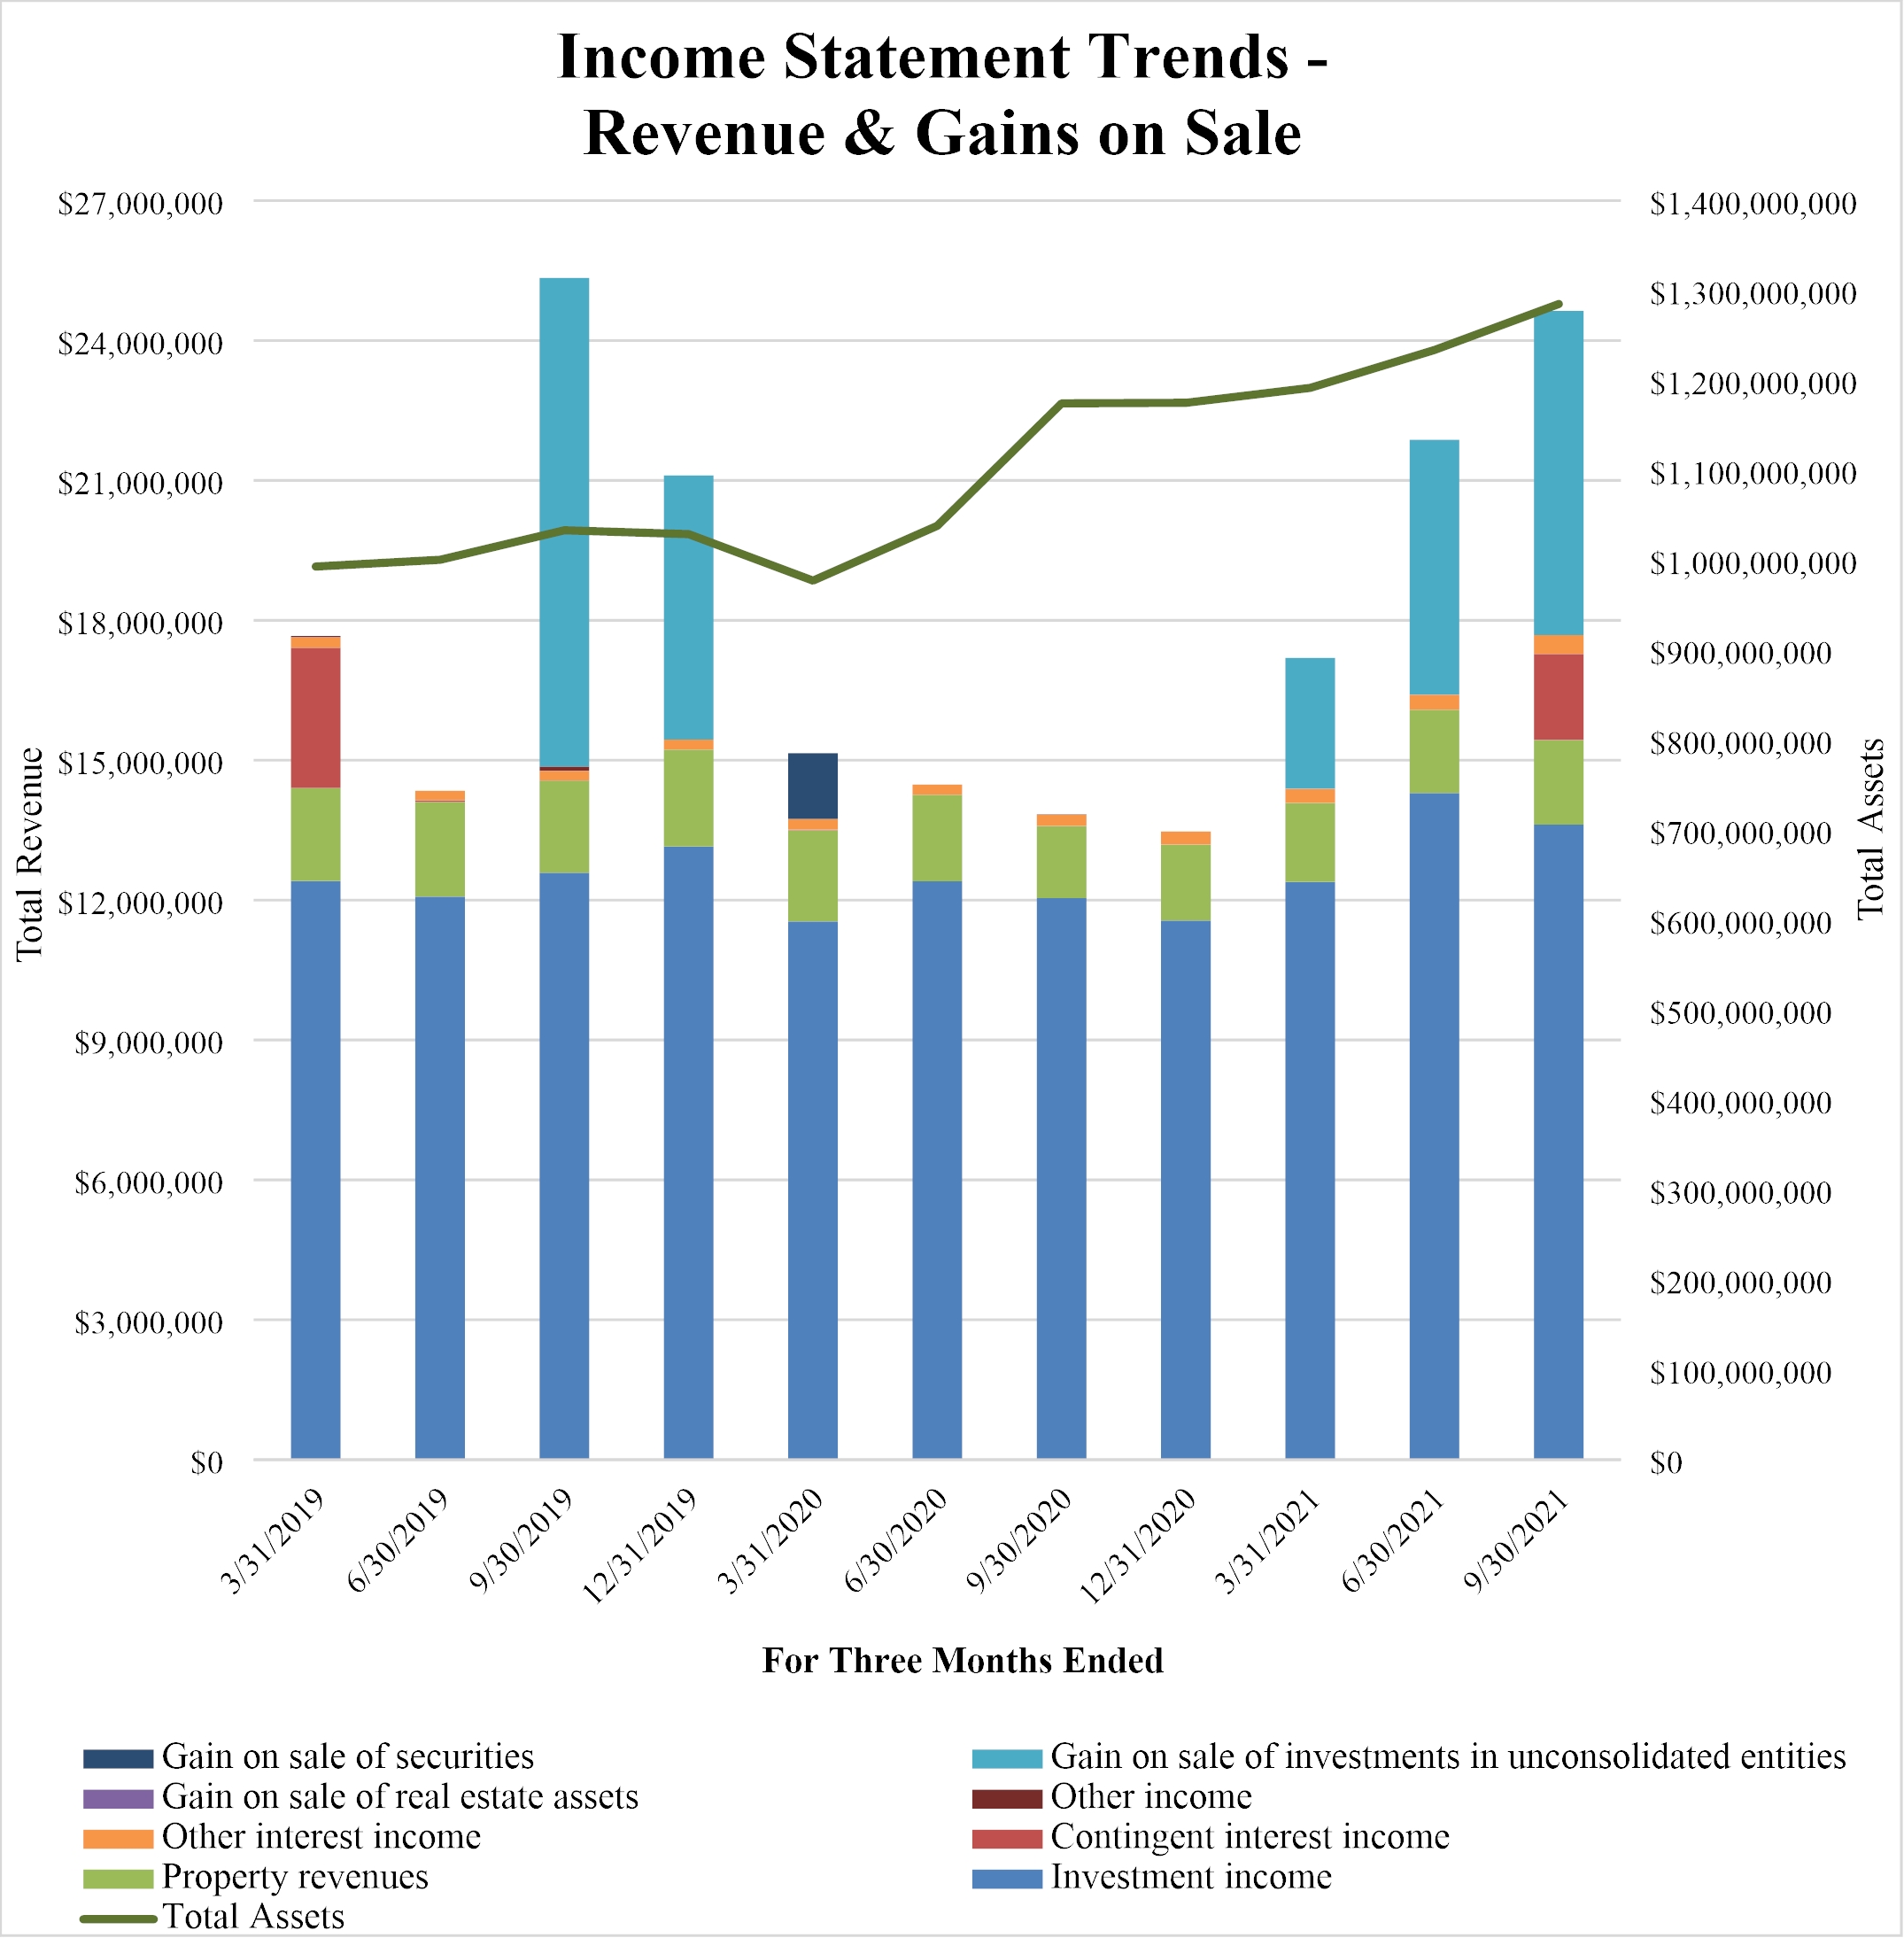
TOTAL REVENUE & GAIN ON SALE TRENDS
|
|
11 |
|
|
|
|
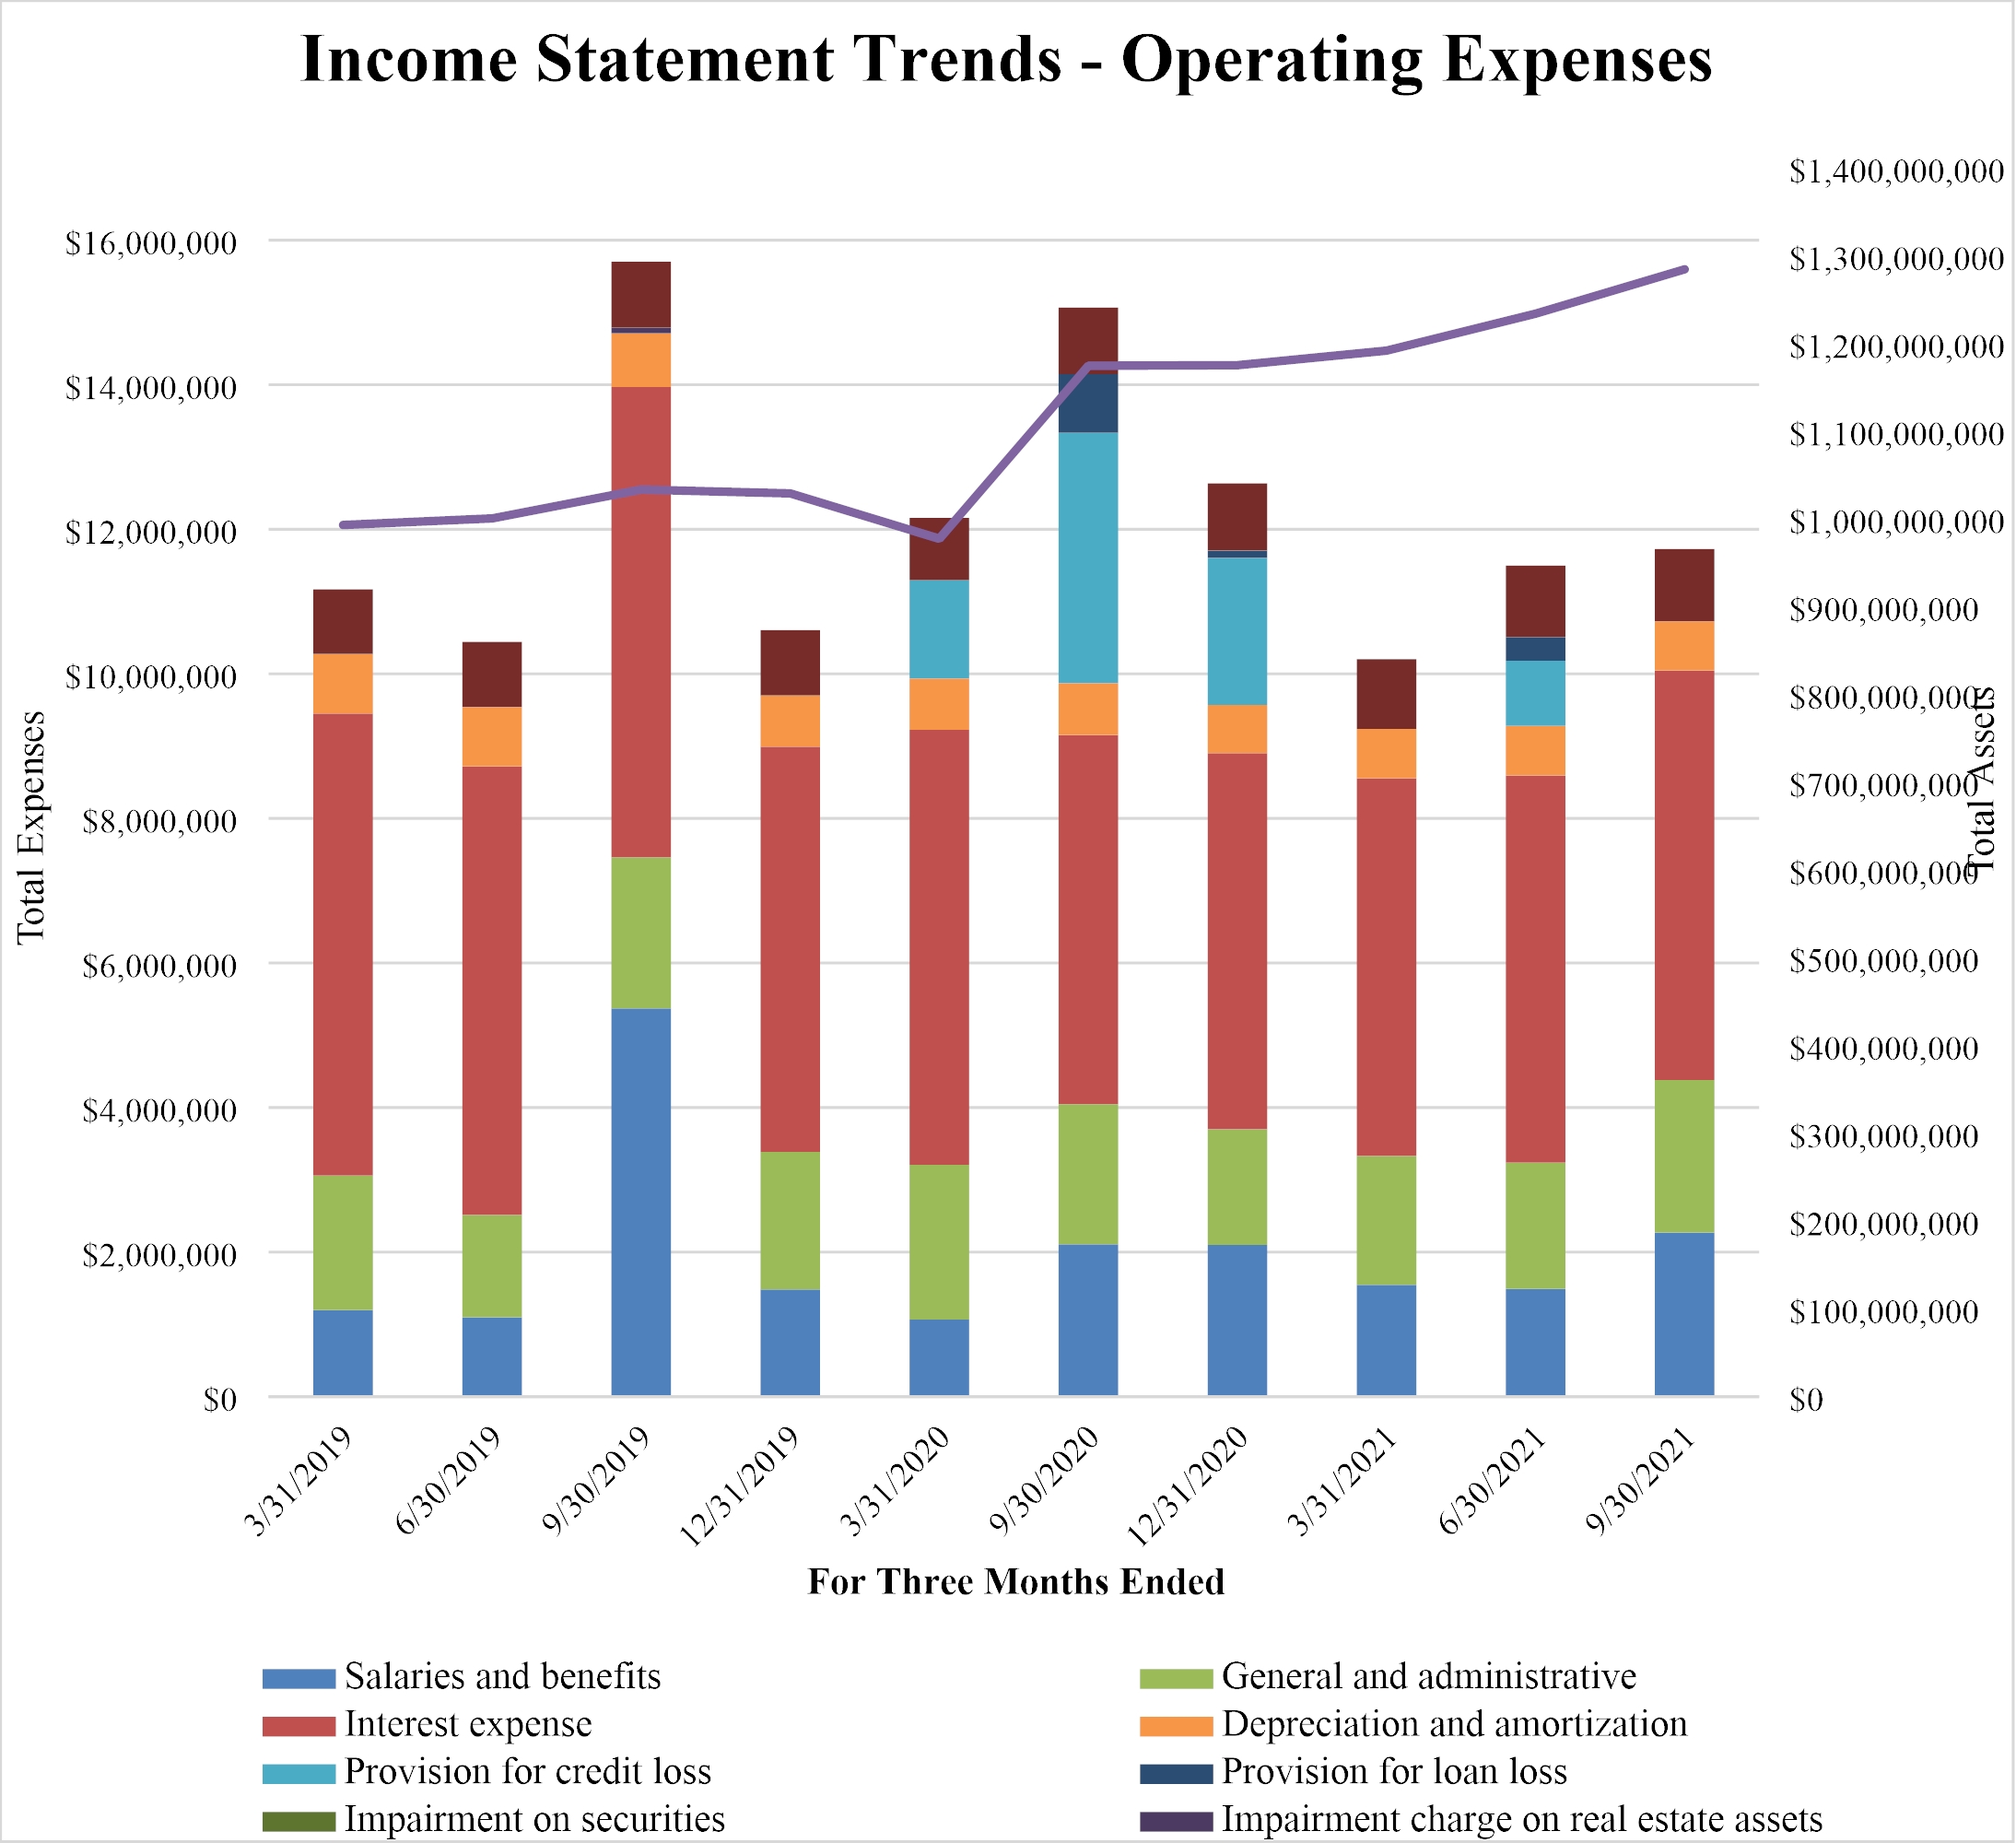
OPERATING EXPENSE TRENDS
|
|
• |
Since October 1, 2019, the ratio of “Salaries and benefits” and “General and administrative” expenses to Total assets has averaged approximately 0.31% per quarter. |
|
|
• |
Salaries and benefits expense for the three months ended September 30, 2019 includes approximately $2.7 million of expense related to the accelerated vesting of restricted units upon the change in control of ATAX’s general partner on September 10, 2019. |
|
OTHER PARTNERSHIP INFORMATION |
|||||
|
|
|
|
|
||
|
Corporate Office: |
|
|
Transfer Agent:
|
||
|
14301 FNB Parkway |
|
|
American Stock Transfer & Trust Company |
||
|
Suite 211 |
|
|
59 Maiden Lane |
||
|
Omaha, NE 68154 |
|
|
Plaza Level |
||
|
Phone: |
402-952-1235 |
|
New York, NY 10038 |
||
|
Investor & K-1 Services: |
855-4AT-AXK1 |
|
|
Phone: 718-921-8124 |
|
|
Web Site: |
www.ataxfund.com |
|
|
888-991-9902 |
|
|
K-1 Services Email: |
k1s@ataxfund.com |
|
|
|
|
|
Ticker Symbol: |
ATAX |
|
|
|
|
|
Corporate Counsel: |
|
Independent Accountants: |
|
Barnes & Thornburg LLP |
|
PwC |
|
11 S. Meridian Street |
|
1 North Wacker Drive |
|
Indianapolis, IN 46204 |
|
Chicago, Illinois 60606 |
|
|
|
|
|
Board of Managers of Greystone AF Manager LLC: |
||
|
(acting as the directors of ATAX) |
||
|
|
|
|
|
Stephen Rosenberg |
|
Chairman of the Board |
|
Curtis A. Pollock |
|
Manager |
|
Jeffrey M. Baevsky |
|
Manager |
|
Drew C. Fletcher |
|
Manager |
|
Steven C. Lilly |
|
Manager |
|
W. Kimball Griffith |
|
Manager |
|
Deborah A. Wilson |
|
Manager |
|
|
|
|
|
Corporate Officers: |
||
|
Chief Executive Officer – Kenneth C. Rogozinski |
||
|
Chief Financial Officer – Jesse A. Coury |
||
|
|
12 |
|
|
|
|
AMERICA FIRST MULTIFAMILY INVESTORS, L.P.
CASH AVAILABLE FOR DISTRIBUTION (CAD) AND OTHER PERFORMANCE MEASURES
The following table contains reconciliations of the Partnership’s GAAP net income to its CAD:
|
|
For the Three |
|
|
For the Nine |
|
||
|
|
Months Ended |
|
|
Months Ended |
|
||
|
|
September 30, 2021 |
|
|
September 30, 2021 |
|
||
|
Net income |
$ |
12,988,384 |
|
|
$ |
30,245,918 |
|
|
Change in fair value of derivatives and interest rate derivative amortization |
|
9,261 |
|
|
|
11,304 |
|
|
Depreciation and amortization expense |
|
680,925 |
|
|
|
2,049,269 |
|
|
Provision for credit loss |
|
- |
|
|
|
900,080 |
|
|
Provision for loan loss |
|
- |
|
|
|
330,116 |
|
|
Amortization of deferred financing costs |
|
368,829 |
|
|
|
823,212 |
|
|
Restricted unit compensation expense |
|
570,467 |
|
|
|
839,551 |
|
|
Deferred income taxes |
|
(42,011 |
) |
|
|
(77,681 |
) |
|
Redeemable Preferred Unit distribution and accretion |
|
(717,762 |
) |
|
|
(2,153,288 |
) |
|
Tier 2 Income distributable to the General Partner |
|
(534,873 |
) |
|
|
(2,603,020 |
) |
|
Bond purchase premium (discount) amortization (accretion), net of cash received |
|
(17,846 |
) |
|
|
(54,552 |
) |
|
Total CAD |
$ |
13,305,374 |
|
|
$ |
30,310,909 |
|
|
|
|
|
|
|
|
|
|
|
Weighted average number of BUCs outstanding, basic |
|
60,646,528 |
|
|
|
60,637,976 |
|
|
|
|
|
|
|
|
|
|
|
Partnership Only: |
|
|
|
|
|
|
|
|
Net income per BUC, basic |
$ |
0.19 |
|
|
$ |
0.42 |
|
|
Total CAD per BUC, basic |
$ |
0.22 |
|
|
$ |
0.50 |
|
|
Distributions declared per BUC |
$ |
0.11 |
|
|
$ |
0.31 |
|
|
|
13 |
|
|
|
|
AMERICA FIRST MULTIFAMILY INVESTORS, L.P.
TAX INCOME INFORMATION RELATED TO BENEFICIAL UNIT CERTIFICATES
The following table summarizes tax-exempt and taxable income as percentages of total income allocated to the Partnership’s BUCs on Schedule K-1 for tax years 2018 to 2020. This disclosure relates only to income allocated to the Partnership’s BUCs and does not consider an individual unitholder’s basis in the BUCs or potential return of capital as such matters are dependent on the individual unitholders’ specific tax circumstances.
|
|
2020 |
|
2019 |
|
2018 |
|
Tax-exempt income |
215% |
|
37% |
|
41% |
|
Taxable income (loss) |
-115% |
(1) |
63% |
|
59% |
|
|
100% |
|
100% |
|
100% |
|
|
|
|
|
|
|
|
|
(1) |
The taxable loss in 2020 is due primarily to net rental real estate losses that exceeded gains on sale for tax purposes during the year related to the Partnership’s investment in unconsolidated entities. |
|
|
14 |